人工智能实践-Tensorflow笔记-MOOC-第二讲神经网络优化
[TOC]
人工智能实践-Tensorflow笔记-MOOC-第二讲神经网络优化 预备知识 tf.where() | 判断
1 tf.where(条件语句, 真返回A, 假返回B)
1 2 3 4 a=tf.constant([1 , 2 , 3 , 1 , 1 ]) b=tf.constant([0 , 1 , 3 , 4 , 5 ]) c=tf.where(tf.greater(a, b), a, b) print ("c:" , c)
运行结果:1 c: tf.Tensor([1 2 3 4 5], shape=(5,), dtype=int32)
np.random.RandomState.rand() | 随机数
1 np.random.RandomState.rand(维度)
1
2
3
4
5
6
import numpy as nprdm = np.random.RandomState(seed = 1 ) a = rdm.rand() b = rdm.rand(2 , 3 ) print ("a:" , a)print ("b:" , b)
运行结果:
1
2
3
a: 0.417022004702574 b: [[7.20324493e-01 1.14374817e-04 3.02332573e-01] [1.46755891e-01 9.23385948e-02 1.86260211e-01]]
np.vstack() | 拼接叠加
1
2
3
4
5
import numpy as npa = np.array([1 , 2 , 3 ]) b = np.array([4 , 5 , 6 ]) c = np.vstack((a, b)) print ("c:\n" , c)
运行结果:
np.mgrid .ravel .c | 网格坐标点 通常配合使用,可以生成网格坐标点
np.mgrid
1 2 np.mgrid[起始值 : 结束值 : 步长 , 起始值 : 结束值 : 步长 , … ]
x.ravel()
相当于把变量拉直
np.c
1 2 3 4 5 6 7 8 9 10 11 12 13 14 15 16 17 18 import numpy as npx, y = np.mgrid [1 :3 :1 , 2 :4 :0.5 ] grid = np.c_[x.ravel(), y.ravel()] print ("x:" , x)print ("y:" , y)print ('grid:\n' , grid)
运行结果:
1 2 3 4 5 6 7 8 9 10 11 12 13 14 x = [[1. 1. 1. 1.] [2. 2. 2. 2.]] y = [[2. 2.5 3. 3.5] [2. 2.5 3. 3.5]] grid: [[1. 2. ] [1. 2.5] [1. 3. ] [1. 3.5] [2. 2. ] [2. 2.5] [2. 3. ] [2. 3.5]]
复杂度学习率 空间复杂度 用神经网络层数和神经网络中待优化参数的个数表示
时间复杂度 可以用神经网络中乘加运算的次数表示
计算神经网络层数时,只统计具有运算能力的层
输入层仅仅把数据传输过来,没有运算,统计网络层数时候,不算输入层
输入层和输出层之间,所有层都叫做隐藏层
神经网络的层数是n个隐藏层的层数加上1个输出层
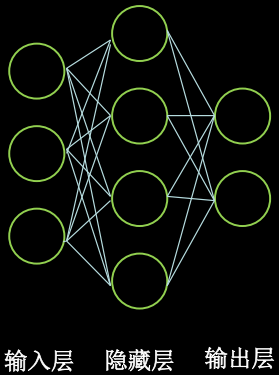
时间空间复杂度 输入层有三个节点
隐藏层只有一层,有四个节点
输出层有两个节点
这个网络共有两层神经网络,分别是隐藏层和输出层
参数的个数是所有w和b的总数
第一层参数是三行四列个w加上4个偏置项b,每个神经元有一个偏置项b,有3 * 4 + 4 = 16 个参数
第二层参数是四行两列个w加上2个偏置项b,每个神经元有一个偏置项b,有4 * 2 + 2 = 10 个参数
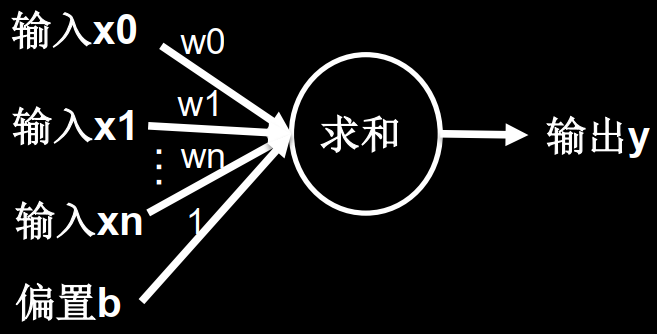
每个具有计算能力的神经元小球,都要收集前一层的每一个输入特征乘以各自线上的权重w,再加上这个神经元的偏置项b。
空间复杂度分析 层数 = 隐藏层的层数 + 1个输出层 = 2
总参数 = 总w + 总b = 26
时间复杂度分析 乘加运算次数 = 20
学习率 $ w_{t+1} $ : 更新后的参数
$ w_{t} $ : 当前参数
$ lr $ : 学习率
$ \frac{\partial loss}{\partial w_{t}} $ :损失函数的梯度(偏导数)
损失函数:
$ \frac{\partial loss}{\partial w_{t}} = 2w+2 $
参数w初始化为5,学习率为0.2,则
1 2 3 4 5 6 7 8 9 10 11 12 13 14 15 16 import tensorflow as tfw = tf.Variable(tf.constant(5 , dtype=tf.float32)) lr = 0.2 epoch = 40 for epoch in range (epoch): with tf.GradientTape() as tape: loss = tf.square(w + 1 ) grads = tape.gradient(loss, w) w.assign_sub(lr * grads) print ("After %s epoch,w is %f,loss is %f" % (epoch, w.numpy(), loss))
输出1 2 3 4 5 6 7 8 9 10 11 12 13 14 15 16 17 18 19 20 21 22 23 24 25 26 27 28 29 30 31 32 33 34 35 36 37 38 39 40 After 0 epoch,w is 2.600000,loss is 36.000000 After 1 epoch,w is 1.160000,loss is 12.959999 After 2 epoch,w is 0.296000,loss is 4.665599 After 3 epoch,w is -0.222400,loss is 1.679616 After 4 epoch,w is -0.533440,loss is 0.604662 After 5 epoch,w is -0.720064,loss is 0.217678 After 6 epoch,w is -0.832038,loss is 0.078364 After 7 epoch,w is -0.899223,loss is 0.028211 After 8 epoch,w is -0.939534,loss is 0.010156 After 9 epoch,w is -0.963720,loss is 0.003656 After 10 epoch,w is -0.978232,loss is 0.001316 After 11 epoch,w is -0.986939,loss is 0.000474 After 12 epoch,w is -0.992164,loss is 0.000171 After 13 epoch,w is -0.995298,loss is 0.000061 After 14 epoch,w is -0.997179,loss is 0.000022 After 15 epoch,w is -0.998307,loss is 0.000008 After 16 epoch,w is -0.998984,loss is 0.000003 After 17 epoch,w is -0.999391,loss is 0.000001 After 18 epoch,w is -0.999634,loss is 0.000000 After 19 epoch,w is -0.999781,loss is 0.000000 After 20 epoch,w is -0.999868,loss is 0.000000 After 21 epoch,w is -0.999921,loss is 0.000000 After 22 epoch,w is -0.999953,loss is 0.000000 After 23 epoch,w is -0.999972,loss is 0.000000 After 24 epoch,w is -0.999983,loss is 0.000000 After 25 epoch,w is -0.999990,loss is 0.000000 After 26 epoch,w is -0.999994,loss is 0.000000 After 27 epoch,w is -0.999996,loss is 0.000000 After 28 epoch,w is -0.999998,loss is 0.000000 After 29 epoch,w is -0.999999,loss is 0.000000 After 30 epoch,w is -0.999999,loss is 0.000000 After 31 epoch,w is -1.000000,loss is 0.000000 After 32 epoch,w is -1.000000,loss is 0.000000 After 33 epoch,w is -1.000000,loss is 0.000000 After 34 epoch,w is -1.000000,loss is 0.000000 After 35 epoch,w is -1.000000,loss is 0.000000 After 36 epoch,w is -1.000000,loss is 0.000000 After 37 epoch,w is -1.000000,loss is 0.000000 After 38 epoch,w is -1.000000,loss is 0.000000 After 39 epoch,w is -1.000000,loss is 0.000000
lr=0.001过慢
输出:
1 2 3 4 5 6 7 8 9 10 11 12 13 14 15 16 17 18 19 20 21 22 23 24 25 26 27 28 29 30 31 32 33 34 35 36 37 38 39 40 After 0 epoch,w is 4.988000,loss is 36.000000 After 1 epoch,w is 4.976024,loss is 35.856144 After 2 epoch,w is 4.964072,loss is 35.712864 After 3 epoch,w is 4.952144,loss is 35.570156 After 4 epoch,w is 4.940240,loss is 35.428020 After 5 epoch,w is 4.928360,loss is 35.286449 After 6 epoch,w is 4.916503,loss is 35.145447 After 7 epoch,w is 4.904670,loss is 35.005009 After 8 epoch,w is 4.892860,loss is 34.865124 After 9 epoch,w is 4.881075,loss is 34.725803 After 10 epoch,w is 4.869313,loss is 34.587044 After 11 epoch,w is 4.857574,loss is 34.448833 After 12 epoch,w is 4.845859,loss is 34.311172 After 13 epoch,w is 4.834167,loss is 34.174068 After 14 epoch,w is 4.822499,loss is 34.037510 After 15 epoch,w is 4.810854,loss is 33.901497 After 16 epoch,w is 4.799233,loss is 33.766029 After 17 epoch,w is 4.787634,loss is 33.631104 After 18 epoch,w is 4.776059,loss is 33.496712 After 19 epoch,w is 4.764507,loss is 33.362858 After 20 epoch,w is 4.752978,loss is 33.229538 After 21 epoch,w is 4.741472,loss is 33.096756 After 22 epoch,w is 4.729989,loss is 32.964497 After 23 epoch,w is 4.718529,loss is 32.832775 After 24 epoch,w is 4.707092,loss is 32.701576 After 25 epoch,w is 4.695678,loss is 32.570904 After 26 epoch,w is 4.684287,loss is 32.440750 After 27 epoch,w is 4.672918,loss is 32.311119 After 28 epoch,w is 4.661572,loss is 32.182003 After 29 epoch,w is 4.650249,loss is 32.053402 After 30 epoch,w is 4.638949,loss is 31.925320 After 31 epoch,w is 4.627671,loss is 31.797745 After 32 epoch,w is 4.616416,loss is 31.670683 After 33 epoch,w is 4.605183,loss is 31.544128 After 34 epoch,w is 4.593973,loss is 31.418077 After 35 epoch,w is 4.582785,loss is 31.292530 After 36 epoch,w is 4.571619,loss is 31.167484 After 37 epoch,w is 4.560476,loss is 31.042938 After 38 epoch,w is 4.549355,loss is 30.918892 After 39 epoch,w is 4.538256,loss is 30.795341
lr=0.999不收敛
输出:
1 2 3 4 5 6 7 8 9 10 11 12 13 14 15 16 17 18 19 20 21 22 23 24 25 26 27 28 29 30 31 32 33 34 35 36 37 38 39 40 After 0 epoch,w is -6.988000,loss is 36.000000 After 1 epoch,w is 4.976024,loss is 35.856144 After 2 epoch,w is -6.964072,loss is 35.712860 After 3 epoch,w is 4.952145,loss is 35.570156 After 4 epoch,w is -6.940241,loss is 35.428024 After 5 epoch,w is 4.928361,loss is 35.286461 After 6 epoch,w is -6.916504,loss is 35.145462 After 7 epoch,w is 4.904671,loss is 35.005020 After 8 epoch,w is -6.892861,loss is 34.865135 After 9 epoch,w is 4.881076,loss is 34.725815 After 10 epoch,w is -6.869314,loss is 34.587051 After 11 epoch,w is 4.857575,loss is 34.448849 After 12 epoch,w is -6.845860,loss is 34.311192 After 13 epoch,w is 4.834168,loss is 34.174084 After 14 epoch,w is -6.822500,loss is 34.037521 After 15 epoch,w is 4.810855,loss is 33.901508 After 16 epoch,w is -6.799233,loss is 33.766033 After 17 epoch,w is 4.787635,loss is 33.631107 After 18 epoch,w is -6.776060,loss is 33.496716 After 19 epoch,w is 4.764508,loss is 33.362869 After 20 epoch,w is -6.752979,loss is 33.229557 After 21 epoch,w is 4.741473,loss is 33.096771 After 22 epoch,w is -6.729990,loss is 32.964516 After 23 epoch,w is 4.718530,loss is 32.832787 After 24 epoch,w is -6.707093,loss is 32.701580 After 25 epoch,w is 4.695680,loss is 32.570911 After 26 epoch,w is -6.684288,loss is 32.440765 After 27 epoch,w is 4.672919,loss is 32.311131 After 28 epoch,w is -6.661573,loss is 32.182014 After 29 epoch,w is 4.650250,loss is 32.053413 After 30 epoch,w is -6.638950,loss is 31.925329 After 31 epoch,w is 4.627672,loss is 31.797762 After 32 epoch,w is -6.616417,loss is 31.670694 After 33 epoch,w is 4.605185,loss is 31.544140 After 34 epoch,w is -6.593974,loss is 31.418095 After 35 epoch,w is 4.582787,loss is 31.292547 After 36 epoch,w is -6.571621,loss is 31.167505 After 37 epoch,w is 4.560478,loss is 31.042959 After 38 epoch,w is -6.549357,loss is 30.918919 After 39 epoch,w is 4.538259,loss is 30.795368
指数衰减学习率 可以先用较大的学习率,快速得到较优解,然后逐步减小学习率,使模型在训练后期稳定。
初始学习率、学习率衰减率、多少轮衰减一次:超参数
当前轮数:变量、计数器,可以用当前跌倒了多少次数据集,也就是epoch数值表示;也可以用当前一共迭代了多少次batch也就是golobal_step表示
多少轮衰减一次:迭代多少次数据集,或者迭代多少次batch更新一次学习率;决定了学习率更新的频率
指数衰减学习率的计算一般写在for循环中
在上个代码中添加指数衰减学习率后
使得学习率根据迭代的轮数指数衰减了
1 2 3 4 5 6 7 8 9 10 11 12 13 14 15 16 17 18 import tensorflow as tfw = tf.Variable(tf.constant(5 , dtype=tf.float32)) epoch = 40 LR_BASE = 0.2 LR_DECAY = 0.99 LR_STEP = 1 for epoch in range (epoch): lr = LR_BASE * LR_DECAY ** (epoch / LR_STEP) with tf.GradientTape() as tape: loss = tf.square(w + 1 ) grads = tape.gradient(loss, w) w.assign_sub(lr * grads) print ("After %s epoch,w is %f,loss is %f,lr is %f" % (epoch, w.numpy(), loss, lr))
运行结果:
1
2
3
4
5
6
7
8
9
10
11
12
13
14
15
16
17
18
19
20
21
22
23
24
25
26
27
28
29
30
31
32
33
34
35
36
37
38
39
40
After 0 epoch,w is 2.600000,loss is 36.000000,lr is 0.200000 After 1 epoch,w is 1.174400,loss is 12.959999,lr is 0.198000 After 2 epoch,w is 0.321948,loss is 4.728015,lr is 0.196020 After 3 epoch,w is -0.191126,loss is 1.747547,lr is 0.194060 After 4 epoch,w is -0.501926,loss is 0.654277,lr is 0.192119 After 5 epoch,w is -0.691392,loss is 0.248077,lr is 0.190198 After 6 epoch,w is -0.807611,loss is 0.095239,lr is 0.188296 After 7 epoch,w is -0.879339,loss is 0.037014,lr is 0.186413 After 8 epoch,w is -0.923874,loss is 0.014559,lr is 0.184549 After 9 epoch,w is -0.951691,loss is 0.005795,lr is 0.182703 After 10 epoch,w is -0.969167,loss is 0.002334,lr is 0.180876 After 11 epoch,w is -0.980209,loss is 0.000951,lr is 0.179068 After 12 epoch,w is -0.987226,loss is 0.000392,lr is 0.177277 After 13 epoch,w is -0.991710,loss is 0.000163,lr is 0.175504 After 14 epoch,w is -0.994591,loss is 0.000069,lr is 0.173749 After 15 epoch,w is -0.996452,loss is 0.000029,lr is 0.172012 After 16 epoch,w is -0.997660,loss is 0.000013,lr is 0.170292 After 17 epoch,w is -0.998449,loss is 0.000005,lr is 0.168589 After 18 epoch,w is -0.998967,loss is 0.000002,lr is 0.166903 After 19 epoch,w is -0.999308,loss is 0.000001,lr is 0.165234 After 20 epoch,w is -0.999535,loss is 0.000000,lr is 0.163581 After 21 epoch,w is -0.999685,loss is 0.000000,lr is 0.161946 After 22 epoch,w is -0.999786,loss is 0.000000,lr is 0.160326 After 23 epoch,w is -0.999854,loss is 0.000000,lr is 0.158723 After 24 epoch,w is -0.999900,loss is 0.000000,lr is 0.157136 After 25 epoch,w is -0.999931,loss is 0.000000,lr is 0.155564 After 26 epoch,w is -0.999952,loss is 0.000000,lr is 0.154009 After 27 epoch,w is -0.999967,loss is 0.000000,lr is 0.152469 After 28 epoch,w is -0.999977,loss is 0.000000,lr is 0.150944 After 29 epoch,w is -0.999984,loss is 0.000000,lr is 0.149434 After 30 epoch,w is -0.999989,loss is 0.000000,lr is 0.147940 After 31 epoch,w is -0.999992,loss is 0.000000,lr is 0.146461 After 32 epoch,w is -0.999994,loss is 0.000000,lr is 0.144996 After 33 epoch,w is -0.999996,loss is 0.000000,lr is 0.143546 After 34 epoch,w is -0.999997,loss is 0.000000,lr is 0.142111 After 35 epoch,w is -0.999998,loss is 0.000000,lr is 0.140690 After 36 epoch,w is -0.999999,loss is 0.000000,lr is 0.139283 After 37 epoch,w is -0.999999,loss is 0.000000,lr is 0.137890 After 38 epoch,w is -0.999999,loss is 0.000000,lr is 0.136511 After 39 epoch,w is -0.999999,loss is 0.000000,lr is 0.135146
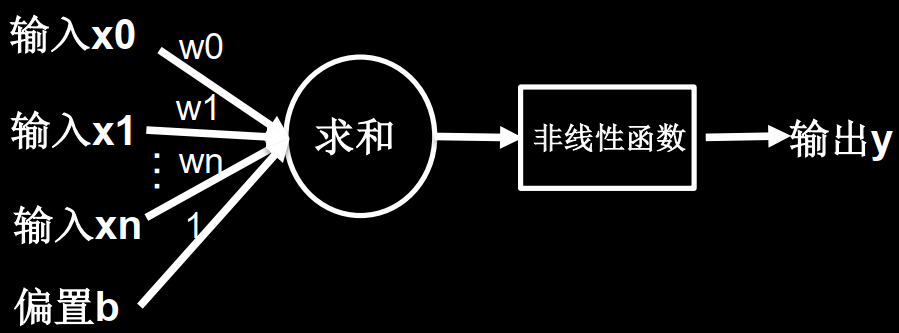
激活函数 鸢尾花的神经网络模型如下图所示,其激活函数是线性函数,即使增加网络层数,依旧为线性,模型的表达能力不够。
相较于线性网络结构,多了一个非线性函数,叫做激活函数,提升了模型的表达力。
使得网络不再是简单的线性组合,可以随着层数的增加提升表达能力。
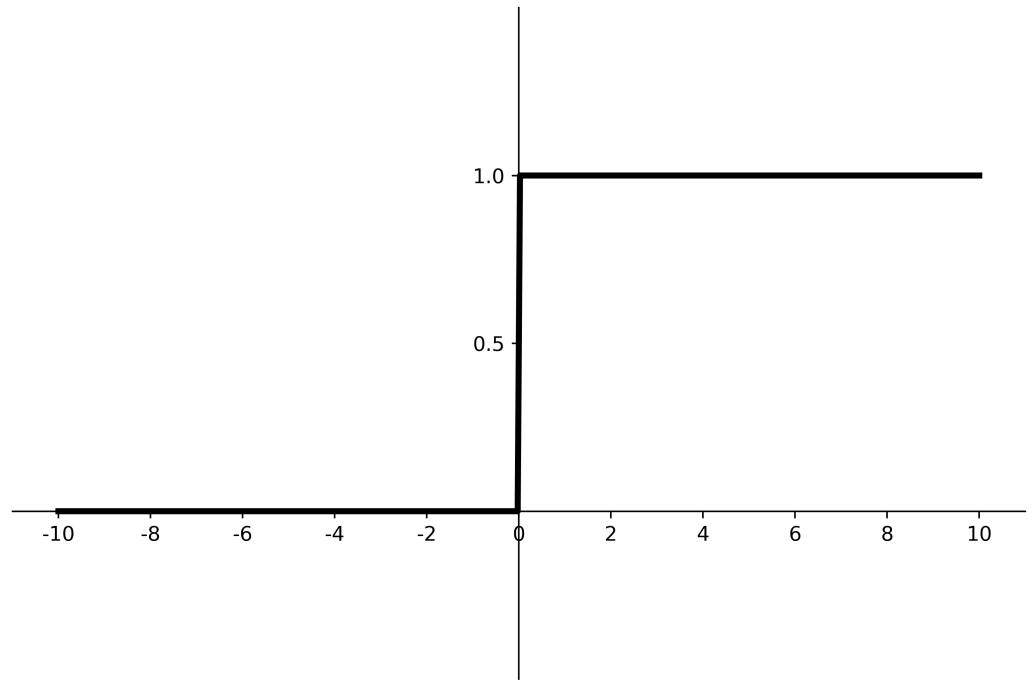
优秀的激活函数 • 非线性: 激活函数非线性时,多层神经网络可逼近所有函数
• 可微性: 优化器大多用梯度下降更新参数
• 单调性: 当激活函数是单调的,能保证单层网络的损失函数是凸函数
• 近似恒等性: f(x)≈x当参数初始化为随机小值时,神经网络更稳定
激活函数输出值的范围 • 激活函数输出为有限值时,权重对特征的影响会更显著,基于梯度的优化方法更稳定
• 激活函数输出为无限值时,参数的初始值对模型的影响非常大,建议调小学习率
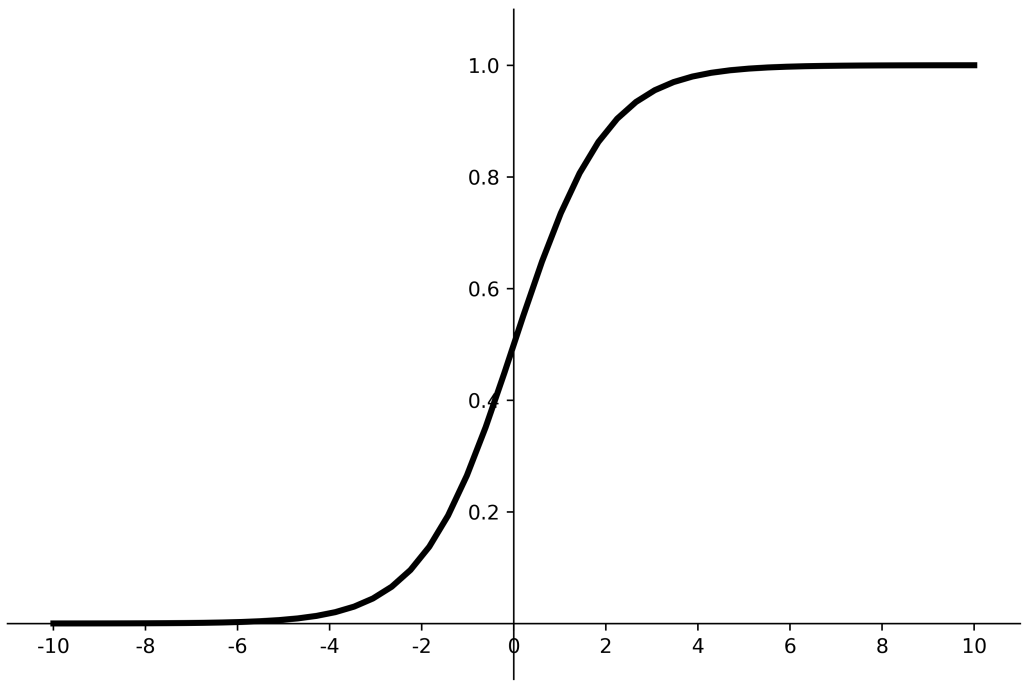
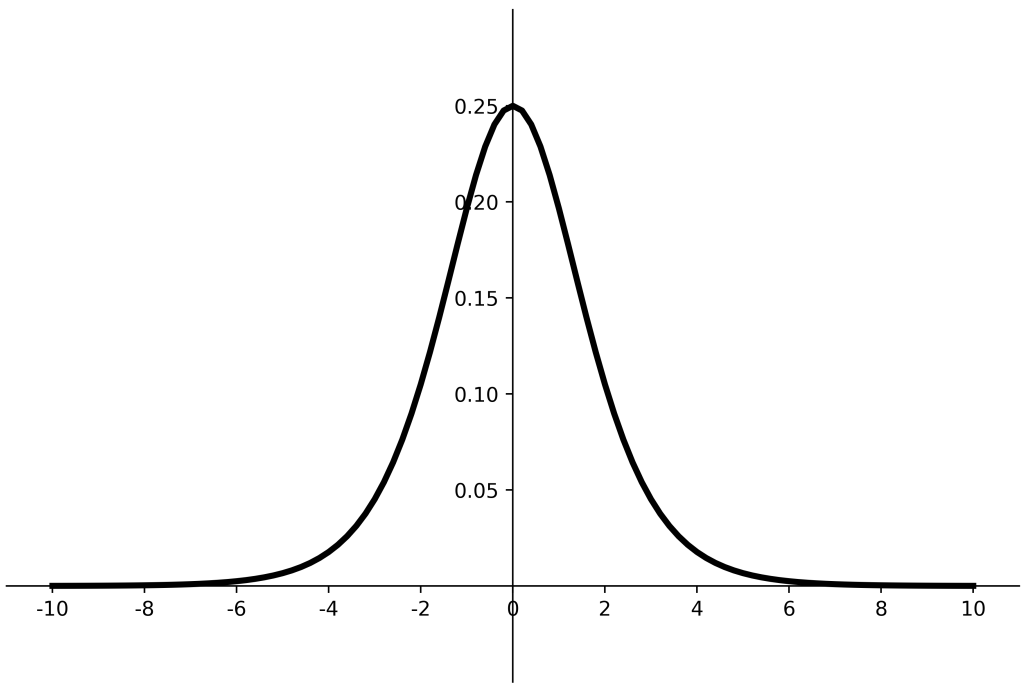
常用激活函数 Sigmoid函数 Sigmoid函数把输入值变换到0~1之间输出
输入非常大的负数,为0;输入非常大的整数,为1。相当于归一化操作。
深层神经网络更新参数时,需要从输出层到输入层逐层进行链式求导。但Sigmoid函数的倒数输出是0~0.25之间的小数。会出现多个0到0.25之间的连续相乘,结果将趋近于0,产生梯度消失,使得参数无法继续更新。我们希望输入每层神经网络的特征是以0为均值的小数值。但是如果Sigmoid激活函数后的数据都是正数,会使得收敛变慢。另外,Sigmoid函数存在幂运算计算复杂度过大,训练时间长。
特点:
(1)易造成梯度消失
(2)输出非0均值,收敛慢
(3)幂运算复杂,训练时间长
Sigmoid函数API 1 2 3 tf.math.sigmoid( x, name = None )
功能:计算x每一个元素的Sigmoid值
等价API:tf.nn.sigmoid, tf.sigmoid
参数:x : 张量x
返回:与x shape相同的张量
案例:
1 2 3 4 5 6 7 x = tf.constant([1. , 2. , 3. ], ) print (tf.math.sigmoid(x))>>> tf.Tensor([0.7310586 0.880797 0.95257413 ], shape=(3 ,), dtype=float32)>>> print (1 /(1 +tf.math.exp(-x)))>>> tf.Tensor([0.7310586 0.880797 0.95257413 ], shape=(3 ,), dtype=float32)
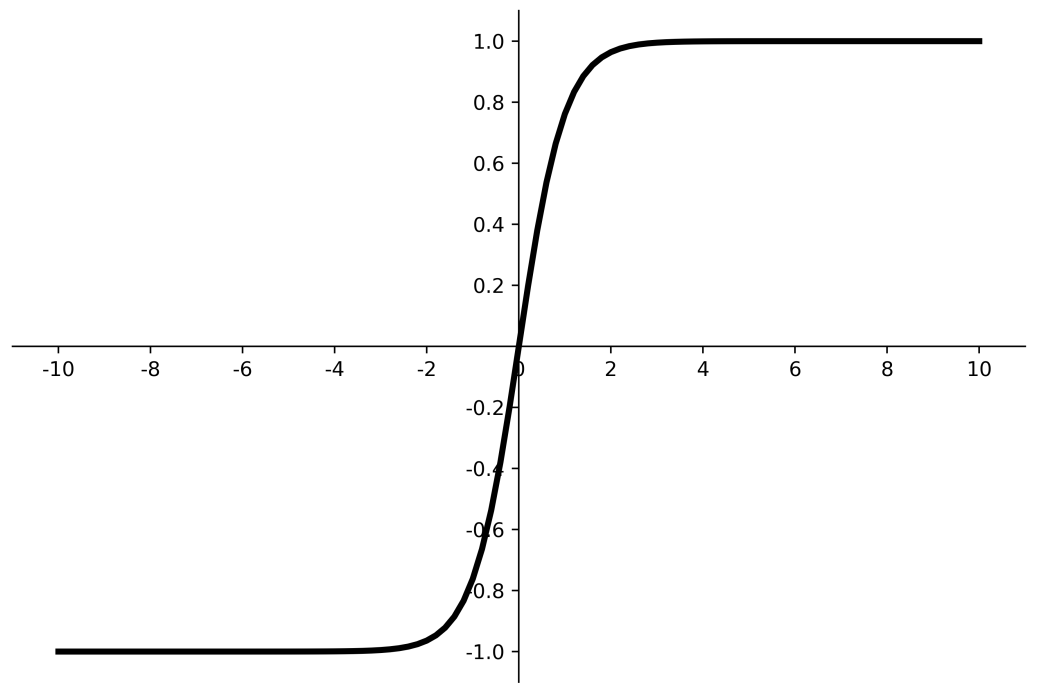
Tanh函数 特点:
(1)输出是0均值
(2)易造成梯度消失
(3)幂运算复杂,训练时间长
Tanh函数API 1 2 3 tf.math.tanh( x, name = None )
功能:计算x每一个元素的Tanh值
等价API:tf.nn.tanh, tf.tanh
参数:x : 张量x
返回:与x shape相同的张量
案例:
1 2 3 4 5 6 7 8 9 x = tf.constant([-float ("inf" ), -5 , -0.5 , 1 , 1.2 , 2 , 3 , float ("inf" )]) print (tf.math.tanh(x))>>> tf.Tensor([-1. -0.99990916 -0.46211717 0.7615942 0.8336547 0.9640276 0.9950547 1. ], shape=(8 ,), dtype=float32)print ((tf.math.exp(x)-tf.math.exp(-x))/(tf.math.exp(x)+tf.math.exp(-x)))>>> tf.Tensor([nan -0.9999091 -0.46211714 0.7615942 0.83365464 0.9640275 0.9950547 nan], shape=(8 ,), dtype=float32)
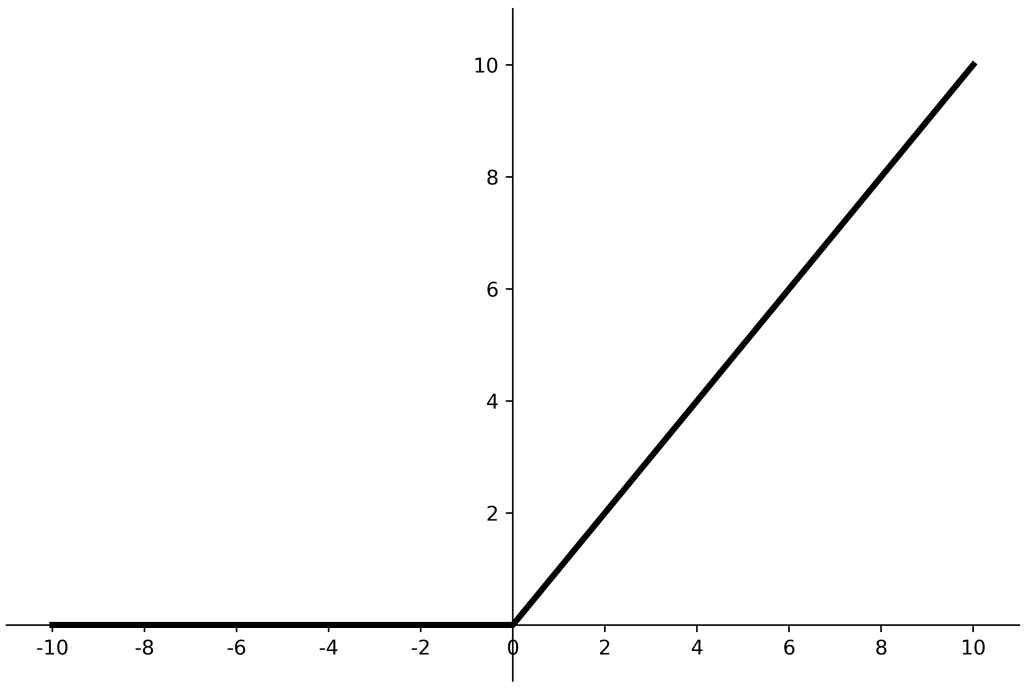
Relu函数 优点:
(1) 解决了梯度消失问题 (在正区间)
(2) 只需判断输入是否大于0,计算速度快
(3) 收敛速度远快于sigmoid和tanh
缺点:
(1) 输出非0均值,收敛慢
(2) Dead RelU问题:某些神经元可能永远不会被激活,导致相应的参数永远不能被更新。送入激活函数的输入特征是负数时,激活函数输出是0,反向传播得到的梯度是0,参数无法更新,神经元死亡。神经元死亡的原因是,经过relu函数的负数特征过多,可以改进随机初始化,避免过多的负数特征送入relu函数。可以通过设置更小的学习率,减少参数分布的巨大变化,避免训练中产生过多负数特征进入relu函数。
Relu函数API 1 2 3 tf.nn.relu( features, name = None )
功能:计算修正线性值(rectified linear):max(features, 0).
参数:
返回:与features shape相同的张量
例子:
1 2 print (tf.nn.relu([-2. , 0. , -0. , 3. ]))>>> tf.Tensor([0. 0. -0. 3. ], shape=(4 ,), dtype=float32)
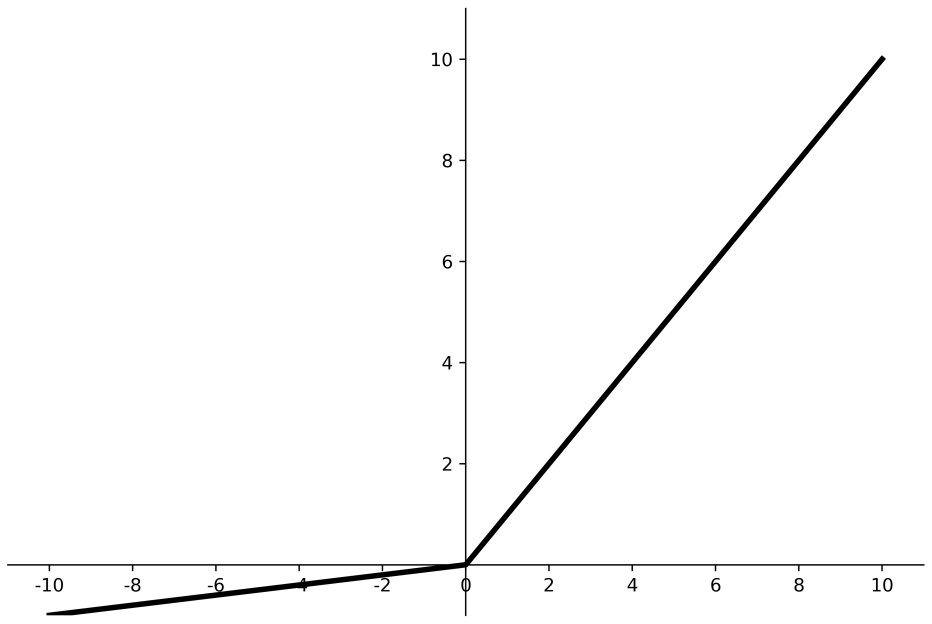
Leaky Relu函数 Leaky Relu函数是为了解决relu负区间为0,引起神经元死亡问题而设计的,Leaky Relu负区间引入了一个固定的斜率α,使得Leaky Relu负区间不再恒等于0。
理论上来讲, Leaky Relu有Relu的所有优点,外加不会有Dead Relu问题,但是在实际操作当中,并没有完全证明Leaky Relu总是好于Relu,选择Relu作为激活函数的网络会更多。
对于初学者的建议:
首选relu激活函数;
学习率设置较小值;
输入特征标准化,即让输入特征满足以0为均值,1为标准差的正态分布;
初始参数中心化,即让随机生成的参数满足以0为均值, $ \sqrt{\frac{2}{当前层输入特征个数}} $ 为标准差的正态分布。
Leaky Relu函数API 1 2 3 tf.nn.leaky_relu( features, alpha=0.2 , name=None )
功能:计算 Leaky Relu值
参数:
返回:与features shape相同的张量
例子:
1 2 print (tf.nn.leaky_relu([-2. , 0. , -0. , 3. ]))>>> tf.Tensor([-0.4 0. -0. 3. ], shape=(4 ,), dtype=float32)
损失函数 损失函数(loss):向前传播计算出的预测值(y)与已知答案( y_ )的差距
神经网络的优化目标就是找到某套参数,使得计算出来的结果y和已知标准答案 y_ 无限接近,也就是他们的差距loss值最小。
主流loss有三种计算方法:均方误差、自定义和交叉熵。
均方误差MSE Tensorflow是这样实现均方误差损失函数计算的。
1 loss_mse = tf.reduce_mean(tf.square(y, y_))
MSE-API 1 2 3 tf.keras.losses.MSE( y_true, y_pred )
功能:计算y_true和y_pred的均方误差
例子:1 2 3 4 5 6 7 8 y_true = tf.constant([0.5 , 0.8 ]) y_pred = tf.constant([1.0 , 1.0 ]) print (tf.keras.losses.MSE(y_true, y_pred))>>> tf.Tensor(0.145 , shape=(), dtype=float32)print (tf.reduce_mean(tf.square(y_true - y_pred)))>>> tf.Tensor(0.145 , shape=(), dtype=float32)
MSE案例 预测酸奶日销量y, x1、 x2是影响日销量的因素。(即已知答案,最佳情况:产量=销量) : y_ = x1 + x2 噪声: -0.05 ~ +0.05 拟合可以预测销量的函数
缺少数据集自己造,一层神经网络,预测酸奶的日销量。
1 2 3 4 5 6 7 8 9 10 11 12 13 14 15 16 17 18 19 20 21 22 23 24 25 26 27 import tensorflow as tfimport numpy as npSEED = 23455 rdm = np.random.RandomState(seed=SEED) x = rdm.rand(32 , 2 ) y_ = [[x1 + x2 + (rdm.rand() / 10.0 - 0.05 )] for (x1, x2) in x] x = tf.cast(x, dtype=tf.float32) w1 = tf.Variable(tf.random.normal([2 , 1 ], stddev=1 , seed=1 )) epoch = 15000 lr = 0.002 for epoch in range (epoch): with tf.GradientTape() as tape: y = tf.matmul(x, w1) loss_mse = tf.reduce_mean(tf.square(y_ - y)) grads = tape.gradient(loss_mse, w1) w1.assign_sub(lr * grads) if epoch % 500 == 0 : print ("After %d training steps,w1 is " % (epoch)) print (w1.numpy(), "\n" ) print ("Final w1 is: " , w1.numpy())
运行结果:
1 2 3 4 5 6 7 8 9 10 11 12 13 14 15 16 17 18 19 20 21 22 23 24 25 26 27 28 29 30 31 32 After 0 training steps,w1 is [[-0.8096241] [ 1.4855157]] ... After 3000 training steps,w1 is [[0.61725086] [1.332841 ]] ... After 6000 training steps,w1 is [[0.88665503] [1.098054 ]] ... After 10000 training steps,w1 is [[0.9801975] [1.0159837]] ... After 12000 training steps,w1 is [[0.9933934] [1.0044063]] ... Final w1 is: [[1.0009792] [0.9977485]]
两个参数正向着1趋近,最后得到神经网络的参数是接近1的。
最终拟合结果:
结果和制造数据集的公式一致。
自定义损失函数 使用均方误差使用损失函数,默认认为销量预测的多了或者少了,损失是一样的。
而真实情况是,商品销量预测多了,损失的是成本;预测少了,损失的是利润。
利润和成本往往不相等,则MSE产生的loss不能使得利益最大化。
使用自定义损失函数,用自定义损失函数计算每一个预测结果y与标准答案 y_ 产生的损失累积和。
y_ :标准答案数据集
可以把损失定义为一个分段函数,如果预测的结果y小于标准答案 y_ ,则预测的y少了,损失的是利润。
自己写出一个损失函数
1 loss_zdy = tf.reduce_sum(tf.where(tf.greater(y, y_), COST * (y-y_), PROFIT * (y_-y)))
如:预测酸奶销量,酸奶成本(COST) 1元,酸奶利润(PROFIT) 99元。预测少了损失利润99元,大于预测多了损失成本1元。预测少了损失大,希望生成的预测函数往多了预测。
自定义损失函数案例 1 2 3 4 5 6 7 8 9 10 11 12 13 14 15 16 17 18 19 20 21 22 23 24 25 26 27 28 29 30 31 32 33 import tensorflow as tfimport numpy as npSEED = 23455 COST = 1 PROFIT = 99 rdm = np.random.RandomState(SEED) x = rdm.rand(32 , 2 ) y_ = [[x1 + x2 + (rdm.rand() / 10.0 - 0.05 )] for (x1, x2) in x] x = tf.cast(x, dtype=tf.float32) w1 = tf.Variable(tf.random.normal([2 , 1 ], stddev=1 , seed=1 )) epoch = 10000 lr = 0.002 for epoch in range (epoch): with tf.GradientTape() as tape: y = tf.matmul(x, w1) loss = tf.reduce_sum(tf.where(tf.greater(y, y_), (y - y_) * COST, (y_ - y) * PROFIT)) grads = tape.gradient(loss, w1) w1.assign_sub(lr * grads) if epoch % 500 == 0 : print ("After %d training steps,w1 is " % (epoch)) print (w1.numpy(), "\n" ) print ("Final w1 is: " , w1.numpy())
运行结果:
1 2 3 4 5 6 7 8 9 10 11 12 13 14 15 16 17 18 19 20 21 22 23 24 25 26 After 0 training steps,w1 is [[2.0855923] [3.8476257]] After 500 training steps,w1 is [[1.1830753] [1.1627482]] After 1000 training steps,w1 is [[1.1526372] [1.0175619]] ... After 6000 training steps,w1 is [[1.1528853] [1.1765157]] ... After 9500 training steps,w1 is [[1.1611756] [1.0651482]] Final w1 is: [[1.1626335] [1.1191947]]
当cost=1,profit=99时,两个参数都大于1,都大于用均方误差做损失函数时的系数,模型在尽量往多了预测。
最终拟合结果:
当cost=99,profit=1时,结果两个参数均小于1,模型在尽量往少了预测。
最终拟合结果:
交叉熵 交叉熵损失函数CE (Cross Entropy):表征两个概率分布之间的距离。
交叉熵越大,两个概率分布越远;交叉熵越小,两个概率分布越近。
y_ : 真实结果的概率分布y:预测结果的概率分布
通过交叉熵的值可以判断哪一个预测结果和标准答案更接近。
交叉熵损失函数案例 二分类 已知答案 y_ = (1, 0) 预测 y1=(0.6, 0.4) 和 y2=(0.8, 0.2) 哪个更接近标准答案?
因为H1 > H2,所以y2预测更准
1 tf.losses.categorical_crossentropy(y_, y)
1 2 3 4 loss_ce1=tf.losses.categorical_crossentropy([1 , 0 ], [0.6 , 0.4 ]) loss_ce2=tf.losses.categorical_crossentropy([1 , 0 ], [0.8 , 0.2 ]) print ("loss_ce1:" , loss_ce1)print ("loss_ce2:" , loss_ce2)
运行结果:
1 2 loss_ce1: tf.Tensor(0.5108256, shape=(), dtype=float32) loss_ce2: tf.Tensor(0.22314353, shape=(), dtype=float32)
交叉熵-API softmax-API 1 2 3 tf.nn.softmax( logits, axis=None , name=None )
功能:计算softmax激活值
等价API:tf.math.softmax
参数:
返回:与logits shape相同的张量
例子:
1 2 3 4 5 6 7 logits = tf.constant([4. , 5. , 1. ]) print (tf.nn.softmax(logits))>>> tf.Tensor([0.26538792 0.7213992 0.01321289 ], shape=(3 ,), dtype=float32)print (tf.exp(logits) / tf.reduce_sum(tf.exp(logits)))>>> tf.Tensor([0.26538792 0.72139925 0.01321289 ], shape=(3 ,), dtype=float32)
tf.keras.losses.categorical_crossentropy 1 2 3 tf.keras.losses.categorical_crossentropy( y_true, y_pred, from_logits=False , label_smoothing=0 )
功能:计算交叉熵
等价API:tf.losses.categorical_crossentropy
参数:y_true:真实值y_pred:预测值from_logits:y_pred是否为logits张量label_smoothing:[0, 1]之间的小数
返回:交叉熵损失值
例子:
1 2 3 4 5 6 7 8 9 10 11 12 13 y_true = [1 , 0 , 0 ] y_pred1 = [0.5 , 0.4 , 0.1 ] y_pred2 = [0.8 , 0.1 , 0.1 ] print (tf.keras.losses.categorical_crossentropy(y_true, y_pred1))print (tf.keras.losses.categorical_crossentropy(y_true, y_pred2))>>> tf.Tensor(0.6931472 , shape=(), dtype=float32)tf.Tensor(0.22314353 , shape=(), dtype=float32) print (-tf.reduce_sum(y_true * tf.math.log(y_pred1)))print (-tf.reduce_sum(y_true * tf.math.log(y_pred2)))>>> tf.Tensor(0.6931472 , shape=(), dtype=float32)tf.Tensor(0.22314353 , shape=(), dtype=float32)
tf.nn.softmax_cross_entropy_with_logits 1 2 3 tf.nn.softmax_cross_entropy_with_logits( labels, logits, axis=-1 , name=None )
在机器学习中,对于多分类问题,把未经softmax归一化的向量值称为logits。logits经过softmax
功能:logits经过softmax后,与labels进行交叉熵计算
参数:labels::在类别这一维度上,每个向量应服从有效的概率分布。例如,在labels的shape为[batch_size, num_classes]的情况下,labels[i]应服从概率分布。logits:每个类别的激活值,通常是线性层的输出. 激活值需要经过softmax归一化。axis: 类别所在维度,默认是-1,即最后一个维度。
返回:softmax交叉熵损失值。
例子:
1 2 3 4 5 6 7 8 labels = [[1.0 , 0.0 , 0.0 ], [0.0 , 1.0 , 0.0 ]] logits = [[4.0 , 2.0 , 1.0 ], [0.0 , 5.0 , 1.0 ]] print (tf.nn.softmax_cross_entropy_with_logits(labels=labels, logits=logits))>>> tf.Tensor([0.16984604 0.02474492 ], shape=(2 ,), dtype=float32)print (-tf.reduce_sum(labels * tf.math.log(tf.nn.softmax(logits)), axis=1 ))>>> tf.Tensor([0.16984606 0.02474495 ], shape=(2 ,), dtype=float32)
tf.nn.sparse_softmax_cross_entropy_with_logits 1 2 3 tf.nn.sparse_softmax_cross_entropy_with_logits( labels, logits, name=None )
功能:labels经过one-hot编码,logits经过softmax,两者进行交叉熵计算。通常labels的shape为[batch_size],logits的shape为[batch_size, num_classes]。sparse可理解为对labels进行稀疏化处理(即进行one-hot编码)
参数:labels:标签的索引值logits:每个类别的激活值,通常是线性层的输出。激活值需要经过softmax归一化。
返回:softmax交叉熵损失值
例子:(下例中先对labels进行one-hot编码为[[1,0,0], [0,1,0]],logits经过softmax变为[[0.844,
1 2 3 4 5 6 7 8 labels = [0 , 1 ] logits = [[4.0 , 2.0 , 1.0 ], [0.0 , 5.0 , 1.0 ]] print (tf.nn.sparse_softmax_cross_entropy_with_logits(labels1, logits))>>> tf.Tensor([0.16984604 0.02474492 ], shape=(2 ,), dtype=float32)print (-tf.reduce_sum(tf.one_hot(labels, tf.shape(logits)[1 ]) * tf.math.log(tf.nn.softmax(logits)), axis=1 ))>>> tf.Tensor([0.16984606 0.02474495 ], shape=(2 ,), dtype=float32)
softmax与交叉熵结合 输出先过softmax函数,再计算 y 与 y_ 的交叉熵损失函数。
同时计算概率分布和交叉熵的函数
1 tf.nn.softmax_cross_entropy_with_logits(y_, y)
1 2 3 4 5 6 7 8 9 10 11 12 import tensorflow as tfimport numpy as npy_ = np.array([[1 , 0 , 0 ], [0 , 1 , 0 ], [0 , 0 , 1 ], [1 , 0 , 0 ], [0 , 1 , 0 ]]) y = np.array([[12 , 3 , 2 ], [3 , 10 , 1 ], [1 , 2 , 5 ], [4 , 6.5 , 1.2 ], [3 , 6 , 1 ]]) y_pro = tf.nn.softmax(y) loss_ce1 = tf.losses.categorical_crossentropy(y_,y_pro) loss_ce2 = tf.nn.softmax_cross_entropy_with_logits(y_, y) print ('分步计算的结果:\n' , loss_ce1)print ('结合计算的结果:\n' , loss_ce2)
运行结果:
1 2 3 4 5 6 7 8 分步计算的结果: tf.Tensor( [1.68795487e-04 1.03475622e-03 6.58839038e-02 2.58349207e+00 5.49852354e-02], shape=(5,), dtype=float64) 结合计算的结果: tf.Tensor( [1.68795487e-04 1.03475622e-03 6.58839038e-02 2.58349207e+00 5.49852354e-02], shape=(5,), dtype=float64)
缓解过拟合
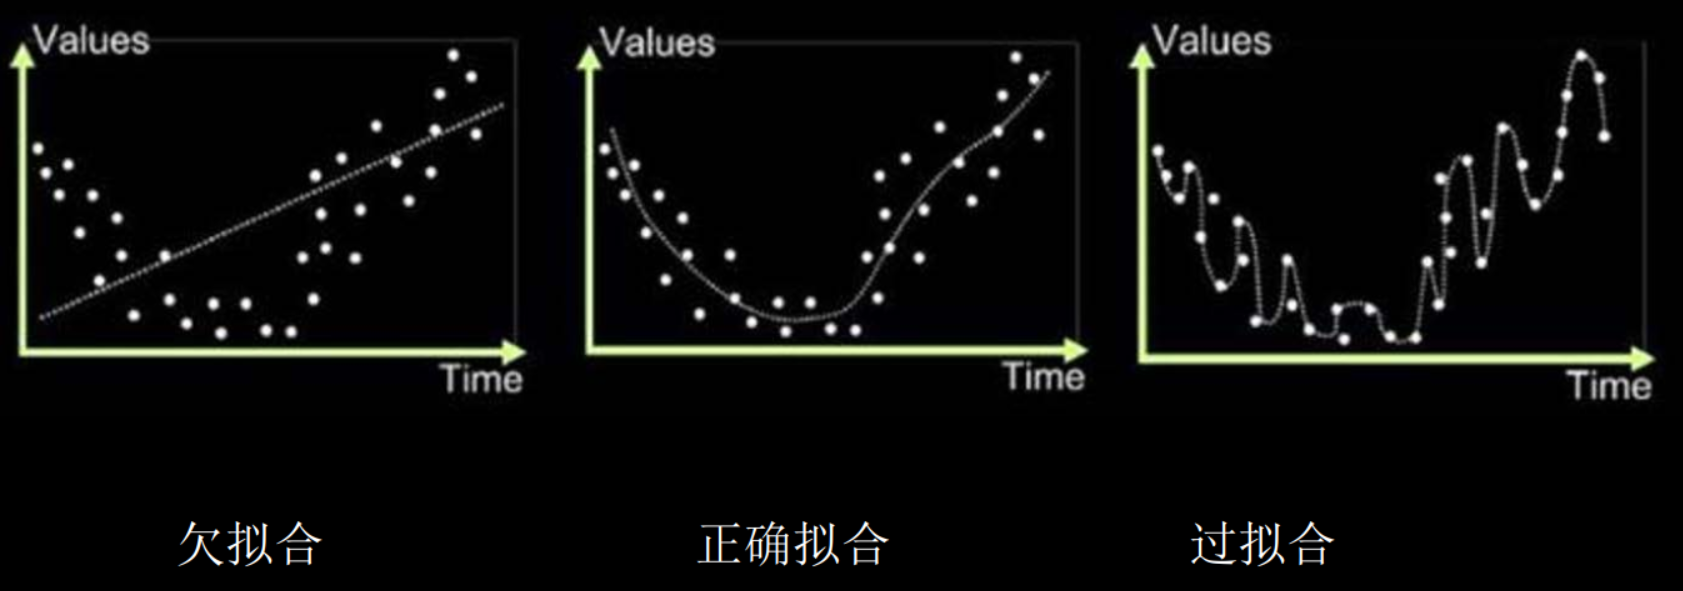
欠拟合:对现有数据集学习的不够彻底
过拟合:模型对当前数据拟合得太好了,但对未出现的新数据难以做出正确的判断,模型缺少泛化能力
欠拟合的解决方法
过拟合的解决方法
正则化缓解过拟合 正则化在损失函数中引入模型复杂度指标,利用给W加权值,弱化了训练数据的噪声(一般不正则化b)
使用正则化后,损失函数loss变成两部分的和。
第一部分是以前求得的loss值,描述了预测结果和正确结果之间的差距,比如交叉熵,均方误差等。
第二部分是参数的权重,REGULARIZER给出参数w在总loss中的比例,正则化的权重。
loss(w)的计算可以使用两种方法 一种是对所有参数的w的绝对值求和,L1正则化。
L1正则化大概率会使很多参数变为零,因此该方法可通过稀疏参数,即减少参数的数量,降低复杂度。
二种是对所有参数的w平方求和,L2正则化。
L2正则化会使参数很接近零但不为零,因此该方法可通过减小参数值的大小降低复杂度。可以有效缓解数据集中由于噪声引起的过拟合。
L2正则化计算W过程 1 2 3 4 5 6 7 8 9 10 11 12 13 14 15 16 17 18 with tf.GradientTape() as tape: h1 = tf.matmul(x_train, w1) + bl h1 = tf.nn.relu(h1) y = tf.matmul(h1, w2) + b2 loss_mse = tf.reduce_mean(tf.square(y_train - y)) loss_regularization = [] loss_reqularization.append(tf.nn.12 _loss(w1)) loss_regularization.append(tf.nn.12 _loss(w2)) loss_regularization = tf.reduce_sum(loss_regularization) loss = loss_mse + 0.03 * loss_reqularization variables = [w1, b1, w2, b2] grads = tape.gradient(loss, variables)
测试数据
输入数据:
x1和x2是输入特征,y_c是标签
1 2 3 4 5 6 7 8 9 10 11 12 13 14 15 16 17 18 19 20 21 22 23 24 25 26 27 28 29 x1,x2,y_c -0.416757847,-0.056266827,1 -2.136196096,1.640270808,0 -1.793435585,-0.841747366,0 0.502881417,-1.245288087,1 -1.057952219,-0.909007615,1 0.551454045,2.292208013,0 0.041539393,-1.117925445,1 0.539058321,-0.5961597,1 -0.019130497,1.17500122,1 -0.747870949,0.009025251,1 -0.878107893,-0.15643417,1 0.256570452,-0.988779049,1 -0.338821966,-0.236184031,1 -0.637655012,-1.187612286,1 -1.421217227,-0.153495196,0 -0.26905696,2.231366789,0 -2.434767577,0.112726505,0 0.370444537,1.359633863,1 0.501857207,-0.844213704,1 9.76E-06,0.542352572,1 -0.313508197,0.771011738,1 -1.868090655,1.731184666,0 1.467678011,-0.335677339,0 0.61134078,0.047970592,1 -0.829135289,0.087710218,1 1.000365887,-0.381092518,1 -0.375669423,-0.074470763,1 0.43349633,1.27837923,1
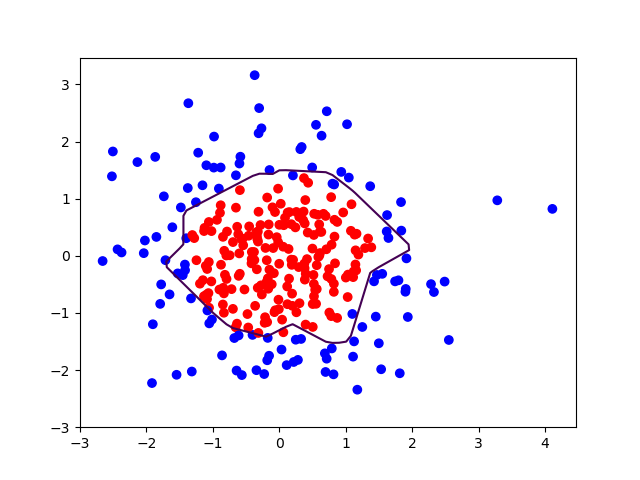
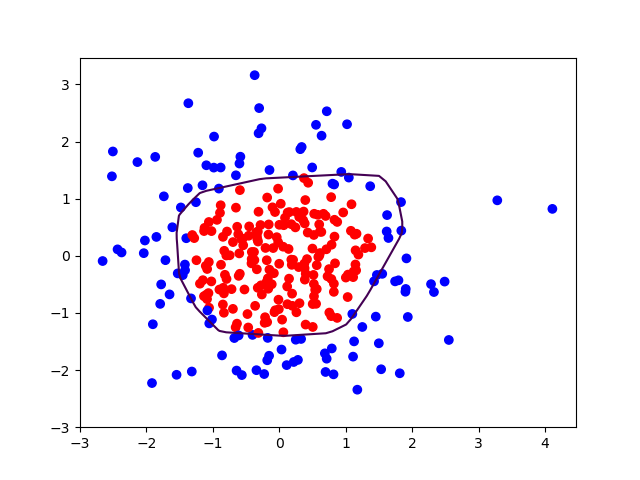
x1和x2作为横纵坐标可视化,标签为1是红色,标签为0是蓝色
先用神经网络拟合出输入特征x1、x2与标签的函数关系,生成网格覆盖这些点。
讲这些网格的交点也就是横纵坐标作为输入送入训练好的神经网络,神经网络会输出一个值,我们要区分输出偏向1还是偏向0。
可以把神经网络输出的预测值为0.5的线标出颜色。也就是红蓝点的区分线。
p29_regularizationfree.py
1 2 3 4 5 6 7 8 9 10 11 12 13 14 15 16 17 18 19 20 21 22 23 24 25 26 27 28 29 30 31 32 33 34 35 36 37 38 39 40 41 42 43 44 45 46 47 48 49 50 51 52 53 54 55 56 57 58 59 60 61 62 63 64 65 66 67 68 69 70 71 72 73 74 75 76 77 78 79 80 81 82 83 84 85 86 87 88 89 import tensorflow as tffrom matplotlib import pyplot as pltimport numpy as npimport pandas as pddf = pd.read_csv('dot.csv' ) x_data = np.array(df[['x1' , 'x2' ]]) y_data = np.array(df['y_c' ]) x_train = np.vstack(x_data).reshape(-1 ,2 ) y_train = np.vstack(y_data).reshape(-1 ,1 ) Y_c = [['red' if y else 'blue' ] for y in y_train] x_train = tf.cast(x_train, tf.float32) y_train = tf.cast(y_train, tf.float32) train_db = tf.data.Dataset.from_tensor_slices((x_train, y_train)).batch(32 ) w1 = tf.Variable(tf.random.normal([2 , 11 ]), dtype=tf.float32) b1 = tf.Variable(tf.constant(0.01 , shape=[11 ])) w2 = tf.Variable(tf.random.normal([11 , 1 ]), dtype=tf.float32) b2 = tf.Variable(tf.constant(0.01 , shape=[1 ])) lr = 0.01 epoch = 400 for epoch in range (epoch): for step, (x_train, y_train) in enumerate (train_db): with tf.GradientTape() as tape: h1 = tf.matmul(x_train, w1) + b1 h1 = tf.nn.relu(h1) y = tf.matmul(h1, w2) + b2 loss = tf.reduce_mean(tf.square(y_train - y)) variables = [w1, b1, w2, b2] grads = tape.gradient(loss, variables) w1.assign_sub(lr * grads[0 ]) b1.assign_sub(lr * grads[1 ]) w2.assign_sub(lr * grads[2 ]) b2.assign_sub(lr * grads[3 ]) if epoch % 20 == 0 : print ('epoch:' , epoch, 'loss:' , float (loss)) print ("*******predict*******" )xx, yy = np.mgrid[-3 :3 :.1 , -3 :3 :.1 ] grid = np.c_[xx.ravel(), yy.ravel()] grid = tf.cast(grid, tf.float32) probs = [] for x_test in grid: h1 = tf.matmul([x_test], w1) + b1 h1 = tf.nn.relu(h1) y = tf.matmul(h1, w2) + b2 probs.append(y) x1 = x_data[:, 0 ] x2 = x_data[:, 1 ] probs = np.array(probs).reshape(xx.shape) plt.scatter(x1, x2, color=np.squeeze(Y_c)) plt.contour(xx, yy, probs, levels=[.5 ]) plt.show()
1 2 3 4 5 6 7 8 9 10 11 12 13 14 15 16 17 18 19 20 epoch: 0 loss: 0.8860995173454285 epoch: 20 loss: 0.07788623124361038 epoch: 40 loss: 0.05887502059340477 epoch: 60 loss: 0.043619509786367416 epoch: 80 loss: 0.03502746298909187 epoch: 100 loss: 0.03013235330581665 epoch: 120 loss: 0.027722788974642754 epoch: 140 loss: 0.026683270931243896 epoch: 160 loss: 0.026026234030723572 epoch: 180 loss: 0.025885531678795815 epoch: 200 loss: 0.025877559557557106 epoch: 220 loss: 0.02594858966767788 epoch: 240 loss: 0.026042431592941284 epoch: 260 loss: 0.026121510192751884 epoch: 280 loss: 0.026135003194212914 epoch: 300 loss: 0.026035090908408165 epoch: 320 loss: 0.02597750537097454 epoch: 340 loss: 0.025903111323714256 epoch: 360 loss: 0.025866234675049782 epoch: 380 loss: 0.02591524086892605
轮廓不够平滑,存在过拟合现象。
加入L2正则化:
p29_regularizationcontain.py
1 2 3 4 5 6 7 8 9 10 11 12 13 14 15 16 17 18 19 20 21 22 23 24 25 26 27 28 29 30 31 32 33 34 35 36 37 38 39 40 41 42 43 44 45 46 47 48 49 50 51 52 53 54 55 56 57 58 59 60 61 62 63 64 65 66 67 68 69 70 71 72 73 74 75 76 77 78 79 80 81 82 83 84 85 86 87 88 89 90 91 92 93 94 95 96 97 98 99 100 101 import tensorflow as tffrom matplotlib import pyplot as pltimport numpy as npimport pandas as pddf = pd.read_csv('dot.csv' ) x_data = np.array(df[['x1' , 'x2' ]]) y_data = np.array(df['y_c' ]) x_train = x_data y_train = y_data.reshape(-1 , 1 ) Y_c = [['red' if y else 'blue' ] for y in y_train] x_train = tf.cast(x_train, tf.float32) y_train = tf.cast(y_train, tf.float32) train_db = tf.data.Dataset.from_tensor_slices((x_train, y_train)).batch(32 ) w1 = tf.Variable(tf.random.normal([2 , 11 ]), dtype=tf.float32) b1 = tf.Variable(tf.constant(0.01 , shape=[11 ])) w2 = tf.Variable(tf.random.normal([11 , 1 ]), dtype=tf.float32) b2 = tf.Variable(tf.constant(0.01 , shape=[1 ])) lr = 0.01 epoch = 400 for epoch in range (epoch): for step, (x_train, y_train) in enumerate (train_db): with tf.GradientTape() as tape: h1 = tf.matmul(x_train, w1) + b1 h1 = tf.nn.relu(h1) y = tf.matmul(h1, w2) + b2 loss_mse = tf.reduce_mean(tf.square(y_train - y)) loss_regularization = [] loss_regularization.append(tf.nn.l2_loss(w1)) loss_regularization.append(tf.nn.l2_loss(w2)) loss_regularization = tf.reduce_sum(loss_regularization) loss = loss_mse + 0.03 * loss_regularization variables = [w1, b1, w2, b2] grads = tape.gradient(loss, variables) w1.assign_sub(lr * grads[0 ]) b1.assign_sub(lr * grads[1 ]) w2.assign_sub(lr * grads[2 ]) b2.assign_sub(lr * grads[3 ]) if epoch % 20 == 0 : print ('epoch:' , epoch, 'loss:' , float (loss)) print ("*******predict*******" )xx, yy = np.mgrid[-3 :3 :.1 , -3 :3 :.1 ] grid = np.c_[xx.ravel(), yy.ravel()] grid = tf.cast(grid, tf.float32) probs = [] for x_predict in grid: h1 = tf.matmul([x_predict], w1) + b1 h1 = tf.nn.relu(h1) y = tf.matmul(h1, w2) + b2 probs.append(y) x1 = x_data[:, 0 ] x2 = x_data[:, 1 ] probs = np.array(probs).reshape(xx.shape) plt.scatter(x1, x2, color=np.squeeze(Y_c)) plt.contour(xx, yy, probs, levels=[.5 ]) plt.show()
1 2 3 4 5 6 7 8 9 10 11 12 13 14 15 16 17 18 19 20 epoch: 0 loss: 1.187268853187561 epoch: 20 loss: 0.4623664319515228 epoch: 40 loss: 0.3910042941570282 epoch: 60 loss: 0.3409908711910248 epoch: 80 loss: 0.2887084484100342 epoch: 100 loss: 0.25472864508628845 epoch: 120 loss: 0.22871072590351105 epoch: 140 loss: 0.20734436810016632 epoch: 160 loss: 0.18896348774433136 epoch: 180 loss: 0.173292875289917 epoch: 200 loss: 0.15965603291988373 epoch: 220 loss: 0.14779284596443176 epoch: 240 loss: 0.137494295835495 epoch: 260 loss: 0.12853200733661652 epoch: 280 loss: 0.12084188312292099 epoch: 300 loss: 0.11422470211982727 epoch: 320 loss: 0.1085757240653038 epoch: 340 loss: 0.10376542061567307 epoch: 360 loss: 0.09959365427494049 epoch: 380 loss: 0.09608905762434006
加入L2正则化后的曲线更平缓,有效缓解了过拟合。
优化器 优化算法可以分成一阶优化和二阶优化算法,其中一阶优化就是指的梯度算法及其变种,而二阶优化一般是用二阶导数(Hessian 矩阵)来计算,如牛顿法,由于需要计算Hessian阵和其逆矩阵,计算量较大,因此没有流行开来。这里主要总结一阶优化的各种梯度下降方法。
深度学习优化算法经历了SGD -> SGDM -> NAG ->AdaGrad -> AdaDelta -> Adam -> Nadam这样的发展历程。
当网络模型固定后,不同参数选取对模型的表达力影响很大。更新模型参数的过程,仿佛是教一个孩子认知世界,达到学龄的孩子,脑神经元的结构、规模是相似的,他们都具备了学习的潜力。但是不同的引导方法,会让孩子具备不同的能力,达到不同的高度。优化器就是引导神经网络更新参数的工具。
本节介绍五种常用的神经网络参数优化器。
定义:待优化参数w,损失函数loss,学习率lr,每次迭代一个batch,t表示当前batch迭代的总次数:
数据集中的数据是以batch为单位,批量喂入网络,每个batch通常包含$2^{n}$个数据,t表示当前batch迭代的总次数。
更新参数分四步完成:
计算t时刻损失函数关于当前参数的梯度:$ g{t} = \nabla loss = \frac{\partial loss}{\partial (w {t})} $
计算t时刻一阶动量 $ m{t} $ 和二阶动量 $ V {t} $
一阶动量:与梯度相关的函数 $ m{t} = \phi(g {1}, g{2},…, g {t}) $
二阶动量:与梯度平方相关的函数 $ V{t} = \psi(g {1}, g{2},…, g {t}) $
计算t时刻下降梯度: $ \eta{t} = lr·m {t} / \sqrt{V_{t}} $
计算t+1时刻参数:$ w{t+1} = w {t} - \eta{t} = w {t} - lr · m{t}/\sqrt{V {t}} $
对于步骤3、4对于各个算法都一样,主要区别在1、2上
SGD随机梯度下降(无momentum) 没有动量的概念。
最大的缺点是下降速度慢,可能会在沟壑的两边持续震荡,停留在一个局部最优点。
$ m{t} = g {t} $
$ V_{t} = 1 $
$ \eta{t} = lr·m {t} / \sqrt{V{t}} = lr · g {t} $
对于单层网络的书写:
1 2 3 w1.assign_sub(lr * grads[0 ]) b1.assign_sub(lr * grads[1 ])
相较于p45_iris.py相比,只改动了四处
p32_sgd.py
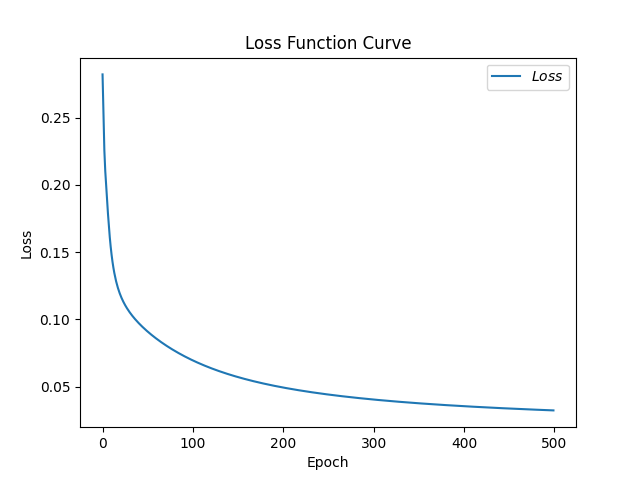
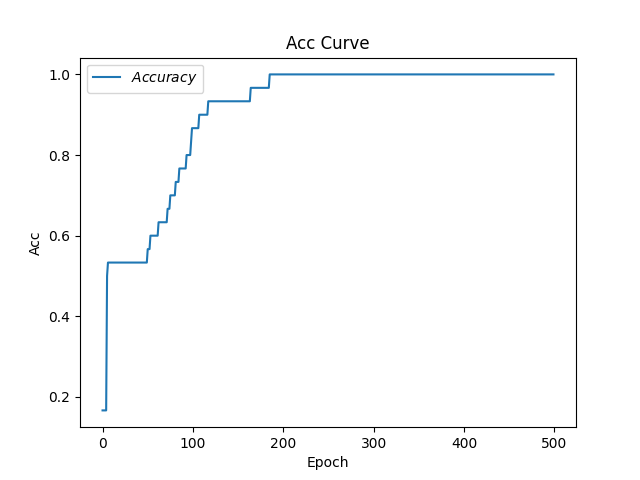
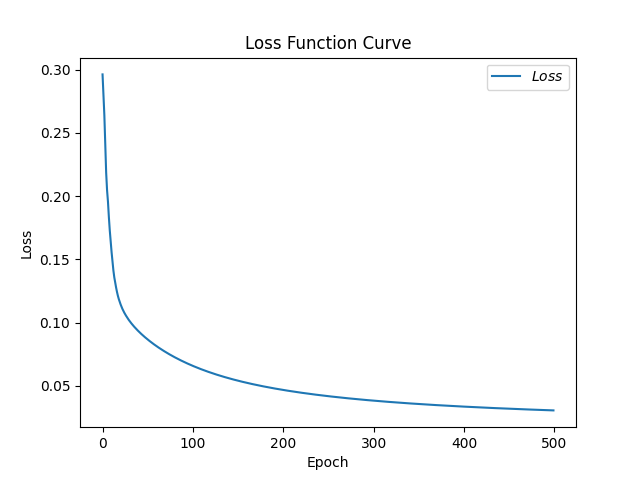
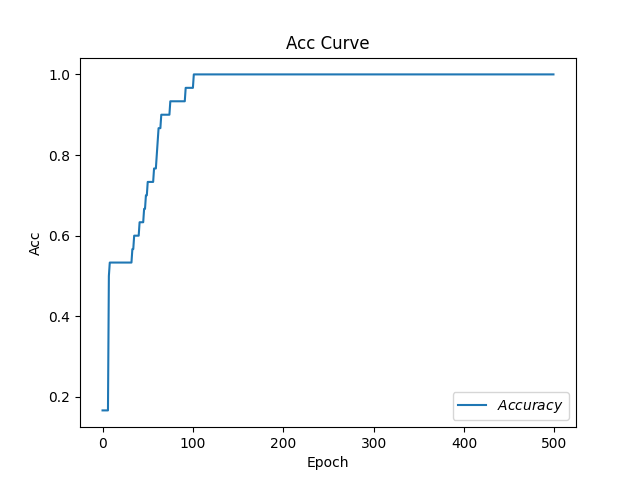
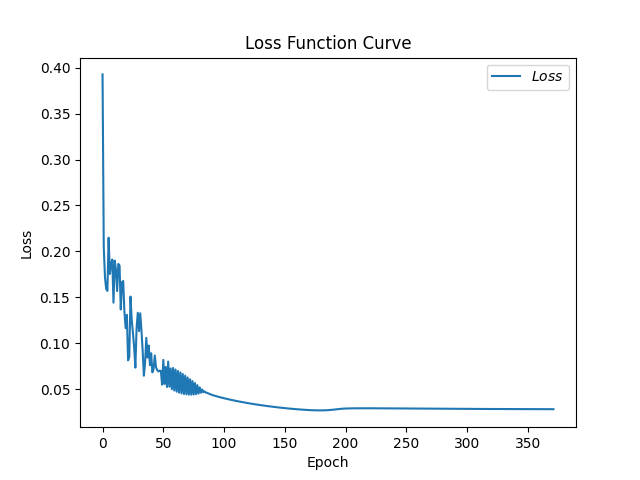
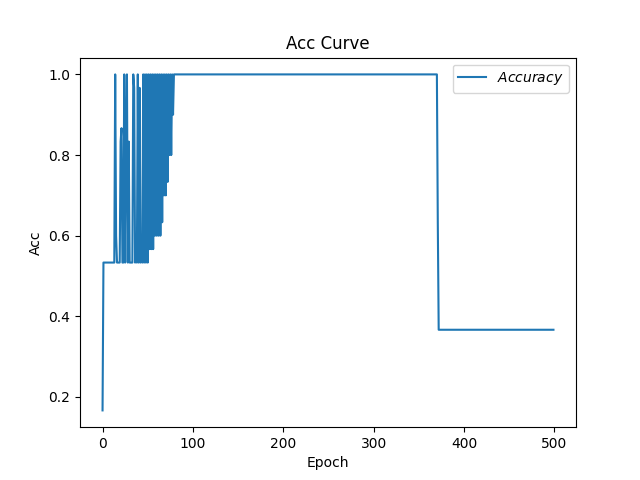
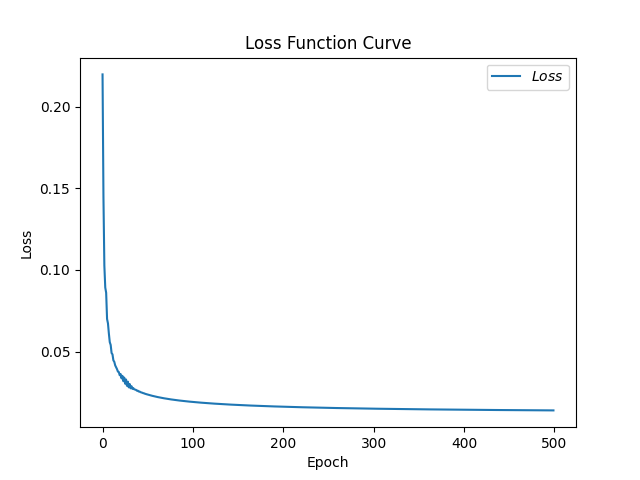
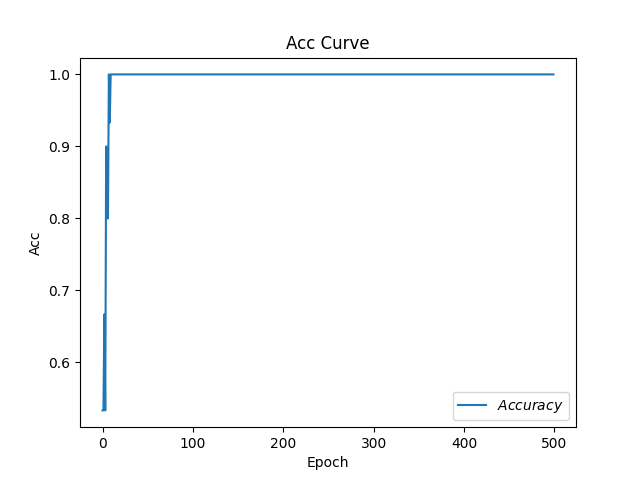
1 2 3 4 5 6 7 8 9 10 11 12 13 14 15 16 17 18 19 20 21 22 23 24 25 26 27 28 29 30 31 32 33 34 35 36 37 38 39 40 41 42 43 44 45 46 47 48 49 50 51 52 53 54 55 56 57 58 59 60 61 62 63 64 65 66 67 68 69 70 71 72 73 74 75 76 77 78 79 80 81 82 83 84 85 86 87 88 89 90 91 92 93 94 95 96 97 98 99 100 101 102 103 104 105 106 107 108 109 110 111 112 113 import tensorflow as tffrom sklearn import datasetsfrom matplotlib import pyplot as pltimport numpy as npimport time x_data = datasets.load_iris().data y_data = datasets.load_iris().target np.random.seed(116 ) np.random.shuffle(x_data) np.random.seed(116 ) np.random.shuffle(y_data) tf.random.set_seed(116 ) x_train = x_data[:-30 ] y_train = y_data[:-30 ] x_test = x_data[-30 :] y_test = y_data[-30 :] x_train = tf.cast(x_train, tf.float32) x_test = tf.cast(x_test, tf.float32) train_db = tf.data.Dataset.from_tensor_slices((x_train, y_train)).batch(32 ) test_db = tf.data.Dataset.from_tensor_slices((x_test, y_test)).batch(32 ) w1 = tf.Variable(tf.random.truncated_normal([4 , 3 ], stddev=0.1 , seed=1 )) b1 = tf.Variable(tf.random.truncated_normal([3 ], stddev=0.1 , seed=1 )) lr = 0.1 train_loss_results = [] test_acc = [] epoch = 500 loss_all = 0 now_time = time.time() for epoch in range (epoch): for step, (x_train, y_train) in enumerate (train_db): with tf.GradientTape() as tape: y = tf.matmul(x_train, w1) + b1 y = tf.nn.softmax(y) y_ = tf.one_hot(y_train, depth=3 ) loss = tf.reduce_mean(tf.square(y_ - y)) loss_all += loss.numpy() grads = tape.gradient(loss, [w1, b1]) w1.assign_sub(lr * grads[0 ]) b1.assign_sub(lr * grads[1 ]) print ("Epoch {}, loss: {}" .format (epoch, loss_all / 4 )) train_loss_results.append(loss_all / 4 ) loss_all = 0 total_correct, total_number = 0 , 0 for x_test, y_test in test_db: y = tf.matmul(x_test, w1) + b1 y = tf.nn.softmax(y) pred = tf.argmax(y, axis=1 ) pred = tf.cast(pred, dtype=y_test.dtype) correct = tf.cast(tf.equal(pred, y_test), dtype=tf.int32) correct = tf.reduce_sum(correct) total_correct += int (correct) total_number += x_test.shape[0 ] acc = total_correct / total_number test_acc.append(acc) print ("Test_acc:" , acc) print ("--------------------------" ) total_time = time.time() - now_time print ("total_time" , total_time) plt.title('Loss Function Curve' ) plt.xlabel('Epoch' ) plt.ylabel('Loss' ) plt.plot(train_loss_results, label="$Loss$" ) plt.legend() plt.show() plt.title('Acc Curve' ) plt.xlabel('Epoch' ) plt.ylabel('Acc' ) plt.plot(test_acc, label="$Accuracy$" ) plt.legend() plt.show()
1 total_time 5.0308239459991455
pycharm导入包出现红线,使用conda命令行使用conda或者pip命令安装即可DLL load failed: 找不到指定的程序。PATH=C:\ProgramData\Anaconda3\Library\bin;
SGDM(含momentum的SGD) 动量法是一种使梯度向量向相关方向加速变化,抑制震荡,最终实现加速收敛的方法。
为了抑制SGD的震荡,SGDM认为梯度下降过程可以加入惯性。下坡的时候,如果发现是陡坡,那就利用惯性跑的快一些。SGDM全称是SGD with Momentum,在SGD基础上引入了一阶动量:
一阶动量是各个时刻梯度方向的指数移动平均值,约等于最近 $ 1/(1-\beta{1}) $ 个时刻的梯度向量和的平均值。也就是说,t时刻的下降方向,不仅由当前点的梯度方向决定,而且由此前累积的下降方向决定。 $ \beta {1} $ 的经验值为0.9,这就意味着下降方向主要偏向此前累积的下降方向,并略微偏向当前时刻的下降方向。
在SGD基础上增加一阶动量。
$ m{t} $ 公式表示各时刻梯度方向的指数滑动平均值,和SGD相比,一阶动量的公式多了 $ m {t-1} $ 这一项, $ m_{t-1} $ 表示上一时刻的一阶动量,上一时刻的一阶动量占大头,$ \beta $ 是一个超参数,是个接近1的数值,经验值是0.9。
二阶动量在SGDM中仍是恒等于1的。
参数更新公式最重要的是把一阶动量和二阶动量计算出来
1 2 3 4 5 6 7 m_w, m_b = 0 , 0 beta = 0.9 m_w = beta * m_w + (1 - beta) * grads [0 ] m_b = beta * m_b + (1 - beta) * grads [1 ] w1.assign_sub(lr * m_w) b1.assign_sub(lr * m_b)
p34_sgdm.py
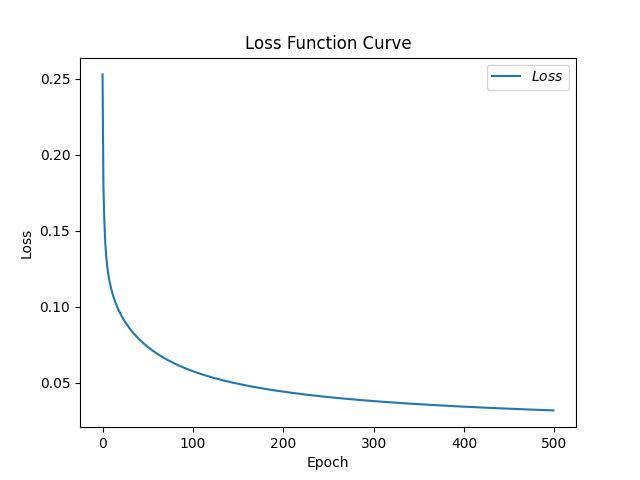
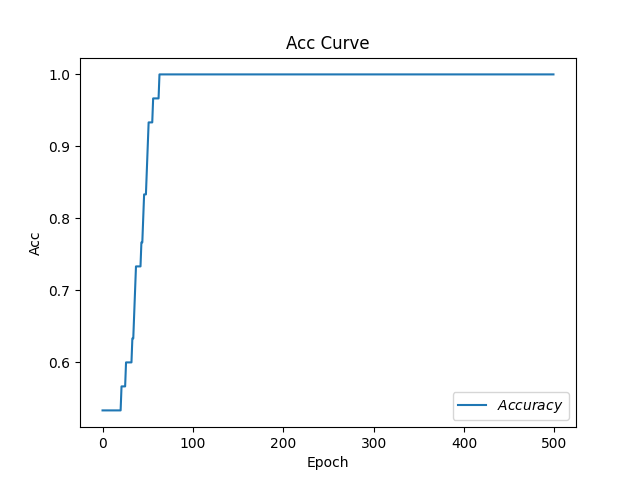
1 2 3 4 5 6 7 8 9 10 11 12 13 14 15 16 17 18 19 20 21 22 23 24 25 26 27 28 29 30 31 32 33 34 35 36 37 38 39 40 41 42 43 44 45 46 47 48 49 50 51 52 53 54 55 56 57 58 59 60 61 62 63 64 65 66 67 68 69 70 71 72 73 74 75 76 77 78 79 80 81 82 83 84 85 86 87 88 89 90 91 92 93 94 95 96 97 98 99 100 101 102 103 104 105 106 107 108 109 110 111 112 113 114 115 116 117 118 119 120 121 import tensorflow as tffrom sklearn import datasetsfrom matplotlib import pyplot as pltimport numpy as npimport time x_data = datasets.load_iris().data y_data = datasets.load_iris().target np.random.seed(116 ) np.random.shuffle(x_data) np.random.seed(116 ) np.random.shuffle(y_data) tf.random.set_seed(116 ) x_train = x_data[:-30 ] y_train = y_data[:-30 ] x_test = x_data[-30 :] y_test = y_data[-30 :] x_train = tf.cast(x_train, tf.float32) x_test = tf.cast(x_test, tf.float32) train_db = tf.data.Dataset.from_tensor_slices((x_train, y_train)).batch(32 ) test_db = tf.data.Dataset.from_tensor_slices((x_test, y_test)).batch(32 ) w1 = tf.Variable(tf.random.truncated_normal([4 , 3 ], stddev=0.1 , seed=1 )) b1 = tf.Variable(tf.random.truncated_normal([3 ], stddev=0.1 , seed=1 )) lr = 0.1 train_loss_results = [] test_acc = [] epoch = 500 loss_all = 0 m_w, m_b = 0 , 0 beta = 0.9 now_time = time.time() for epoch in range (epoch): for step, (x_train, y_train) in enumerate (train_db): with tf.GradientTape() as tape: y = tf.matmul(x_train, w1) + b1 y = tf.nn.softmax(y) y_ = tf.one_hot(y_train, depth=3 ) loss = tf.reduce_mean(tf.square(y_ - y)) loss_all += loss.numpy() grads = tape.gradient(loss, [w1, b1]) m_w = beta * m_w + (1 - beta) * grads[0 ] m_b = beta * m_b + (1 - beta) * grads[1 ] w1.assign_sub(lr * m_w) b1.assign_sub(lr * m_b) print ("Epoch {}, loss: {}" .format (epoch, loss_all / 4 )) train_loss_results.append(loss_all / 4 ) loss_all = 0 total_correct, total_number = 0 , 0 for x_test, y_test in test_db: y = tf.matmul(x_test, w1) + b1 y = tf.nn.softmax(y) pred = tf.argmax(y, axis=1 ) pred = tf.cast(pred, dtype=y_test.dtype) correct = tf.cast(tf.equal(pred, y_test), dtype=tf.int32) correct = tf.reduce_sum(correct) total_correct += int (correct) total_number += x_test.shape[0 ] acc = total_correct / total_number test_acc.append(acc) print ("Test_acc:" , acc) print ("--------------------------" ) total_time = time.time() - now_time print ("total_time" , total_time) plt.title('Loss Function Curve' ) plt.xlabel('Epoch' ) plt.ylabel('Loss' ) plt.plot(train_loss_results, label="$Loss$" ) plt.legend() plt.show() plt.title('Acc Curve' ) plt.xlabel('Epoch' ) plt.ylabel('Acc' ) plt.plot(test_acc, label="$Accuracy$" ) plt.legend() plt.show()
1 total_time 5.486814260482788
SGD with Nesterov Acceleration SGD 还有一个问题是会被困在一个局部最优点里。就像被一个小盆地周围的矮山挡住了视野,看不到更远的更深的沟壑。
我们用这个梯度带入 SGDM 中计算 的式子里去,然后再计算当前时刻应有的梯度并更新这一次的参数。
其基本思路如下图(转自Hinton的Lecture slides):
首先,按照原来的更新方向更新一步(棕色线),然后计算该新位置的梯度方向(红色线),然后用这个梯度方向修正最终的更新方向(绿色线)。上图中描述了两步的更新示意图,其中蓝色线是标准momentum更新路径。
Adagrad 上述SGD算法一直存在一个超参数(Hyper-parameter),即学习率。超参数是训练前需要手动选择的参数,前缀”hyper”就是用于区别训练过程中可自动更新的参数。学习率可以理解为参数w沿着梯度g反方向变化的步长。
SGD对所有的参数使用统一的、固定的学习率,一个自然的想法是对每个参数设置不同的学习率,然而在大型网络中这是不切实际的。因此,为解决此问题,AdaGrad算法被提出,其做法是给学习率一个缩放比例,从而达到了自适应学习率的效果(Ada = Adaptive)。
其思想是:对于频繁更新的参数,不希望被单个样本影响太大,我们给它们很小的学习率;对于偶尔出现的参数,希望能多得到一些信息,我们给它较大的学习率。
那怎么样度量历史更新频率呢?为此引入二阶动量,即该维度上,所有梯度值的平方和:
回顾步骤 3 中的下降梯度:$ \eta{t} = \alpha · m {t} / \sqrt{V{t}} $ 可视为 $ \eta {t} = \frac{\alpha}{\sqrt{V{t}}} · m {t} $ ,即对学习率进行缩放。(一般为了防止分母为 0 ,会对二阶动量加一个平滑项,即$ \eta{t} = \alpha · m {t} / \sqrt{V_{t} + \varepsilon} $, $ \varepsilon $是一个非常小的数。)
AdaGrad 在稀疏数据场景下表现最好。因为对于频繁出现的参数,学习率衰减得快;对于稀疏的参数,学习率衰减得更慢。然而在实际很多情况下,二阶动量呈单调递增,累计从训练开始的梯度,学习率会很快减至0,导致参数不再更新,训练过程提前结束。
在SGD基础上增加二阶动量,可以对模型中的每个参数分配自适应学习率了。
Adagrad的一阶动量和SGD的一阶动量一样,是当前的梯度。
二阶动量是从现在开始,梯度平方的累计和。
$ m{t} = g {t} $
$ V{t} = \sum {\tau = 1}^{t} = g_{\tau}^{2} $
$ \eta{t} = lr·m {t} / \sqrt{V{t}} = lr · g {t} / (\sqrt{ \sum{\tau = 1}^{t} = g {\tau}^{2}}) $
一阶动量mt是当前时刻的梯度
二阶动量是梯度平方的累计和
$ m{t} = g {t} $
$ V{t} = \sum {\tau = 1}^{t} = g_{\tau}^{2} $
1 2 3 4 5 6 v_w, v_b = 0 , 0 v_ w += tf.square(grads[0 ]) v_b += tf.square(grads[1 ]) W1.assign_sub(lr * grads[0 ] / tf.sqrt(v_w)) b1.assign_sub(lr * grads[1 ] / tf.sqrt(v_b))
p36_adagrad.py
1 2 3 4 5 6 7 8 9 10 11 12 13 14 15 16 17 18 19 20 21 22 23 24 25 26 27 28 29 30 31 32 33 34 35 36 37 38 39 40 41 42 43 44 45 46 47 48 49 50 51 52 53 54 55 56 57 58 59 60 61 62 63 64 65 66 67 68 69 70 71 72 73 74 75 76 77 78 79 80 81 82 83 84 85 86 87 88 89 90 91 92 93 94 95 96 97 98 99 100 101 102 103 104 105 106 107 108 109 110 111 112 113 114 115 116 117 118 119 120 import tensorflow as tffrom sklearn import datasetsfrom matplotlib import pyplot as pltimport numpy as npimport time x_data = datasets.load_iris().data y_data = datasets.load_iris().target np.random.seed(116 ) np.random.shuffle(x_data) np.random.seed(116 ) np.random.shuffle(y_data) tf.random.set_seed(116 ) x_train = x_data[:-30 ] y_train = y_data[:-30 ] x_test = x_data[-30 :] y_test = y_data[-30 :] x_train = tf.cast(x_train, tf.float32) x_test = tf.cast(x_test, tf.float32) train_db = tf.data.Dataset.from_tensor_slices((x_train, y_train)).batch(32 ) test_db = tf.data.Dataset.from_tensor_slices((x_test, y_test)).batch(32 ) w1 = tf.Variable(tf.random.truncated_normal([4 , 3 ], stddev=0.1 , seed=1 )) b1 = tf.Variable(tf.random.truncated_normal([3 ], stddev=0.1 , seed=1 )) lr = 0.1 train_loss_results = [] test_acc = [] epoch = 500 loss_all = 0 v_w, v_b = 0 , 0 now_time = time.time() for epoch in range (epoch): for step, (x_train, y_train) in enumerate (train_db): with tf.GradientTape() as tape: y = tf.matmul(x_train, w1) + b1 y = tf.nn.softmax(y) y_ = tf.one_hot(y_train, depth=3 ) loss = tf.reduce_mean(tf.square(y_ - y)) loss_all += loss.numpy() grads = tape.gradient(loss, [w1, b1]) v_w += tf.square(grads[0 ]) v_b += tf.square(grads[1 ]) w1.assign_sub(lr * grads[0 ] / tf.sqrt(v_w)) b1.assign_sub(lr * grads[1 ] / tf.sqrt(v_b)) print ("Epoch {}, loss: {}" .format (epoch, loss_all / 4 )) train_loss_results.append(loss_all / 4 ) loss_all = 0 total_correct, total_number = 0 , 0 for x_test, y_test in test_db: y = tf.matmul(x_test, w1) + b1 y = tf.nn.softmax(y) pred = tf.argmax(y, axis=1 ) pred = tf.cast(pred, dtype=y_test.dtype) correct = tf.cast(tf.equal(pred, y_test), dtype=tf.int32) correct = tf.reduce_sum(correct) total_correct += int (correct) total_number += x_test.shape[0 ] acc = total_correct / total_number test_acc.append(acc) print ("Test_acc:" , acc) print ("--------------------------" ) total_time = time.time() - now_time print ("total_time" , total_time) plt.title('Loss Function Curve' ) plt.xlabel('Epoch' ) plt.ylabel('Loss' ) plt.plot(train_loss_results, label="$Loss$" ) plt.legend() plt.show() plt.title('Acc Curve' ) plt.xlabel('Epoch' ) plt.ylabel('Acc' ) plt.plot(test_acc, label="$Accuracy$" ) plt.legend() plt.show()
1 total_time 5.356388568878174
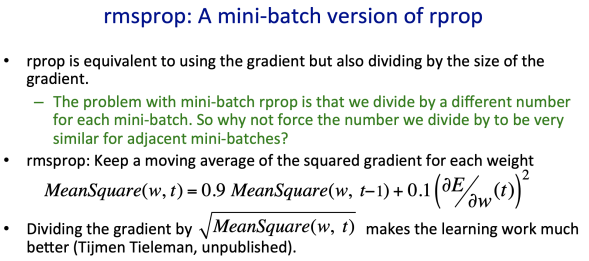
RMSProp RMSProp算法的全称叫 Root Mean Square Prop,是由Geoffrey E. Hinton提出的一种优化算法(Hinton的课件见下图)。由于 AdaGrad 的学习率衰减太过激进,考虑改变二阶动量的计算策略:不累计全部梯度,只关注过去某一窗口内的梯度。修改的思路很直接,前面我们说过,指数移动平均值大约是过去一段时间的平均值,反映“局部的”参数信息,因此我们用这个方法来计算二阶累积动量:
在SGD基础上增加二阶动量
二阶动量v使用指数滑动平均值计算,表征的是过去一段时间的平均值
$ m{t} = g {t} $
$ V{t} = \beta · V {t-1} + (1 - \beta) · g_{t}^{2} $
$ \eta{t} = lr·m {t} / \sqrt{V{t}} = lr · g {t} / (\sqrt{\beta · V{t-1} + (1 - \beta) · g {t}^{2}}) $
1 2 3 4 5 6 7 v_w, v_b = 0 , 0 beta = 0.9 v_w = beta * v_w + (1 - beta) * tf.square(grads[0 ]) v_b = beta * v_b + (1 - beta) * tf.square(grads[1 ]) w1.assign_sub(lr * grads[0 ] / tf.sqrt(v_w)) bl.assign_sub(lr * grads[1 ] / tf.sqrt(v_b))
p38_rmsprop.py
1 2 3 4 5 6 7 8 9 10 11 12 13 14 15 16 17 18 19 20 21 22 23 24 25 26 27 28 29 30 31 32 33 34 35 36 37 38 39 40 41 42 43 44 45 46 47 48 49 50 51 52 53 54 55 56 57 58 59 60 61 62 63 64 65 66 67 68 69 70 71 72 73 74 75 76 77 78 79 80 81 82 83 84 85 86 87 88 89 90 91 92 93 94 95 96 97 98 99 100 101 102 103 104 105 106 107 108 109 110 111 112 113 114 115 116 117 118 119 120 121 import tensorflow as tffrom sklearn import datasetsfrom matplotlib import pyplot as pltimport numpy as npimport time x_data = datasets.load_iris().data y_data = datasets.load_iris().target np.random.seed(116 ) np.random.shuffle(x_data) np.random.seed(116 ) np.random.shuffle(y_data) tf.random.set_seed(116 ) x_train = x_data[:-30 ] y_train = y_data[:-30 ] x_test = x_data[-30 :] y_test = y_data[-30 :] x_train = tf.cast(x_train, tf.float32) x_test = tf.cast(x_test, tf.float32) train_db = tf.data.Dataset.from_tensor_slices((x_train, y_train)).batch(32 ) test_db = tf.data.Dataset.from_tensor_slices((x_test, y_test)).batch(32 ) w1 = tf.Variable(tf.random.truncated_normal([4 , 3 ], stddev=0.1 , seed=1 )) b1 = tf.Variable(tf.random.truncated_normal([3 ], stddev=0.1 , seed=1 )) lr = 0.1 train_loss_results = [] test_acc = [] epoch = 500 loss_all = 0 v_w, v_b = 0 , 0 beta = 0.9 now_time = time.time() for epoch in range (epoch): for step, (x_train, y_train) in enumerate (train_db): with tf.GradientTape() as tape: y = tf.matmul(x_train, w1) + b1 y = tf.nn.softmax(y) y_ = tf.one_hot(y_train, depth=3 ) loss = tf.reduce_mean(tf.square(y_ - y)) loss_all += loss.numpy() grads = tape.gradient(loss, [w1, b1]) v_w = beta * v_w + (1 - beta) * tf.square(grads[0 ]) v_b = beta * v_b + (1 - beta) * tf.square(grads[1 ]) w1.assign_sub(lr * grads[0 ] / tf.sqrt(v_w)) b1.assign_sub(lr * grads[1 ] / tf.sqrt(v_b)) print ("Epoch {}, loss: {}" .format (epoch, loss_all / 4 )) train_loss_results.append(loss_all / 4 ) loss_all = 0 total_correct, total_number = 0 , 0 for x_test, y_test in test_db: y = tf.matmul(x_test, w1) + b1 y = tf.nn.softmax(y) pred = tf.argmax(y, axis=1 ) pred = tf.cast(pred, dtype=y_test.dtype) correct = tf.cast(tf.equal(pred, y_test), dtype=tf.int32) correct = tf.reduce_sum(correct) total_correct += int (correct) total_number += x_test.shape[0 ] acc = total_correct / total_number test_acc.append(acc) print ("Test_acc:" , acc) print ("--------------------------" ) total_time = time.time() - now_time print ("total_time" , total_time) plt.title('Loss Function Curve' ) plt.xlabel('Epoch' ) plt.ylabel('Loss' ) plt.plot(train_loss_results, label="$Loss$" ) plt.legend() plt.show() plt.title('Acc Curve' ) plt.xlabel('Epoch' ) plt.ylabel('Acc' ) plt.plot(test_acc, label="$Accuracy$" ) plt.legend() plt.show()
1 total_time 5.9049718379974365
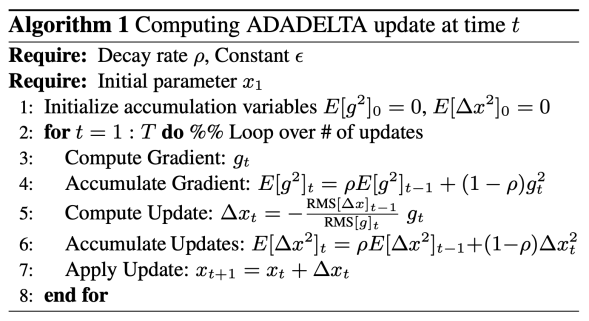
AdaDelta 为解决AdaGrad的学习率递减太快的问题,RMSProp和AdaDelta几乎同时独立被提出。
我们先看论文的AdaDelta算法,下图来自原论文:
对于上图算法的一点解释, $ RMS[g]{t} $ 是梯度$g$的均方根(Root Mean Square), {t-1} $是$ \Delta x $的均方根:
我们可以看到AdaDelta与RMSprop仅仅是分子项不同,为了与前面公式保持一致,在此用$\sqrt{U_{t}}$表示$\eta$的均方根:
我们可以看到AdaDelta与RMSprop仅仅是分子项不同,为了与前面公式保持一致,在此用
代码实现:
1 2 3 4 5 6 7 8 9 10 11 12 13 beta = 0.999 v_w = beta * v_w + (1 - beta) * tf.square(grads[0 ]) v_b = beta * v_b + (1 - beta) * tf.square(grads[1 ]) delta_w = tf.sqrt(u_w) * grads[0 ] / tf.sqrt(v_w) delta_b = tf.sqrt(u_b) * grads[1 ] / tf.sqrt(v_b) u_w = beta * u_w + (1 - beta) * tf.square(delta_w) u_b = beta * u_b + (1 - beta) * tf.square(delta_b) w1.assign_sub(delta_w) b1.assign_sub(delta_b)
Adam Adam名字来源是adaptive moment estimation。Our method is designed to combine the advantages of two recently popular methods: AdaGrad (Duchi et al., 2011), which works well with sparse gradients, and RMSProp (Tieleman & Hinton, 2012), which works well in on-line and non-stationary settings。也就是说,adam融合了Adagrad和RMSprop的思想。
谈到这里,Adam的出现就很自然而然了——它们是前述方法的集大成者。我们看到,SGDM在SGD基础上增加了一阶动量,AdaGrad、RMSProp和AdaDelta在SGD基础上增加了二阶动量。把一阶动量和二阶动量结合起来,再修正偏差,就是Adam了。
同时引入了SGDM一阶动量和RMSProp二阶动量,并在此基础上增加了两个修正项,把修正后的一阶动量和二阶动量带入参数更新公式。
SGDM一阶动量:
RMSProp二阶动量:
其中,参数经验值是$ \beta{1} = 0.9 $ 和 $ \beta {2} = 0.999 $
一阶动量和二阶动量都是按照指数移动平均值进行计算的。初始化 $ m{0} = 0, V {0} = 0 $ ,在初期,迭代得到的 $ m{t} $ 和 $ V {t} $ 会接近于0。我们可以通过对 $ m{t} $ 和 $ V {t} $ 进行偏差修正来解决这一问题:
修正一阶动量的偏差:$ \widehat{m{t}} = \frac{m {t}}{1 - \beta_{1}^{t}} $
修正二阶动量的偏差:$ \widehat{V{t}} = \frac{V {t}}{1 - \beta_{2}^{t}} $
adam一阶动量是和含momentum的SGD一阶动量一样
二阶动量表达是和RMSProp的二阶动量表达式一样
$ \widehat{m{t}} = \frac{m {t}}{1 - \beta_{1}^{t}} $
$ \widehat{V{t}} = \frac{V {t}}{1 - \beta_{2}^{t}} $
1 2 3 4 5 6 7 8 9 10 11 12 13 14 15 16 17 18 19 20 m_w, m_b = 0 , 0 v_w, v_b = 0 , 0 beta1, beta2 = 0.9 , 0.999 delta_w, delta_b = 0 , 0 global_step = 0 m_w = beta1 * m_w + (1 - beta1) * grads[0 ] m_b = beta1 * m_b + (1 - beta1) * grads[1 ] v_w = beta2 * v_w + (1 - beta2) * tf.square(grads[0 ]) v_b = beta2 * v_b + (1 - beta2) * tf.square(grads[1 ]) m_w_correction = m_w / (1 - tf.pow (beta1, int (global_step))) m_b_correction = m_b / (1 - tf.pow (beta1, int (global_step))) v_w_correction = v_w / (1 - tf.pow (beta2, int (global_step))) v_b_correction = v_b / (1 - tf.pow (beta2, int (global_step))) w1.assign_sub(lr * m_w_correction / tf.sqrt(v_w_correction)) b1.assign_sub(lr * m_b_correction / tf.sqrt(v_b_correction))
p40_adam.py
1 2 3 4 5 6 7 8 9 10 11 12 13 14 15 16 17 18 19 20 21 22 23 24 25 26 27 28 29 30 31 32 33 34 35 36 37 38 39 40 41 42 43 44 45 46 47 48 49 50 51 52 53 54 55 56 57 58 59 60 61 62 63 64 65 66 67 68 69 70 71 72 73 74 75 76 77 78 79 80 81 82 83 84 85 86 87 88 89 90 91 92 93 94 95 96 97 98 99 100 101 102 103 104 105 106 107 108 109 110 111 112 113 114 115 116 117 118 119 120 121 122 123 124 125 126 127 128 129 130 131 132 133 134 135 import tensorflow as tffrom sklearn import datasetsfrom matplotlib import pyplot as pltimport numpy as npimport time x_data = datasets.load_iris().data y_data = datasets.load_iris().target np.random.seed(116 ) np.random.shuffle(x_data) np.random.seed(116 ) np.random.shuffle(y_data) tf.random.set_seed(116 ) x_train = x_data[:-30 ] y_train = y_data[:-30 ] x_test = x_data[-30 :] y_test = y_data[-30 :] x_train = tf.cast(x_train, tf.float32) x_test = tf.cast(x_test, tf.float32) train_db = tf.data.Dataset.from_tensor_slices((x_train, y_train)).batch(32 ) test_db = tf.data.Dataset.from_tensor_slices((x_test, y_test)).batch(32 ) w1 = tf.Variable(tf.random.truncated_normal([4 , 3 ], stddev=0.1 , seed=1 )) b1 = tf.Variable(tf.random.truncated_normal([3 ], stddev=0.1 , seed=1 )) lr = 0.1 train_loss_results = [] test_acc = [] epoch = 500 loss_all = 0 m_w, m_b = 0 , 0 v_w, v_b = 0 , 0 beta1, beta2 = 0.9 , 0.999 delta_w, delta_b = 0 , 0 global_step = 0 now_time = time.time() for epoch in range (epoch): for step, (x_train, y_train) in enumerate (train_db): global_step += 1 with tf.GradientTape() as tape: y = tf.matmul(x_train, w1) + b1 y = tf.nn.softmax(y) y_ = tf.one_hot(y_train, depth=3 ) loss = tf.reduce_mean(tf.square(y_ - y)) loss_all += loss.numpy() grads = tape.gradient(loss, [w1, b1]) m_w = beta1 * m_w + (1 - beta1) * grads[0 ] m_b = beta1 * m_b + (1 - beta1) * grads[1 ] v_w = beta2 * v_w + (1 - beta2) * tf.square(grads[0 ]) v_b = beta2 * v_b + (1 - beta2) * tf.square(grads[1 ]) m_w_correction = m_w / (1 - tf.pow (beta1, int (global_step))) m_b_correction = m_b / (1 - tf.pow (beta1, int (global_step))) v_w_correction = v_w / (1 - tf.pow (beta2, int (global_step))) v_b_correction = v_b / (1 - tf.pow (beta2, int (global_step))) w1.assign_sub(lr * m_w_correction / tf.sqrt(v_w_correction)) b1.assign_sub(lr * m_b_correction / tf.sqrt(v_b_correction)) print ("Epoch {}, loss: {}" .format (epoch, loss_all / 4 )) train_loss_results.append(loss_all / 4 ) loss_all = 0 total_correct, total_number = 0 , 0 for x_test, y_test in test_db: y = tf.matmul(x_test, w1) + b1 y = tf.nn.softmax(y) pred = tf.argmax(y, axis=1 ) pred = tf.cast(pred, dtype=y_test.dtype) correct = tf.cast(tf.equal(pred, y_test), dtype=tf.int32) correct = tf.reduce_sum(correct) total_correct += int (correct) total_number += x_test.shape[0 ] acc = total_correct / total_number test_acc.append(acc) print ("Test_acc:" , acc) print ("--------------------------" ) total_time = time.time() - now_time print ("total_time" , total_time) plt.title('Loss Function Curve' ) plt.xlabel('Epoch' ) plt.ylabel('Loss' ) plt.plot(train_loss_results, label="$Loss$" ) plt.legend() plt.show() plt.title('Acc Curve' ) plt.xlabel('Epoch' ) plt.ylabel('Acc' ) plt.plot(test_acc, label="$Accuracy$" ) plt.legend() plt.show()
1 total_time 6.299233913421631
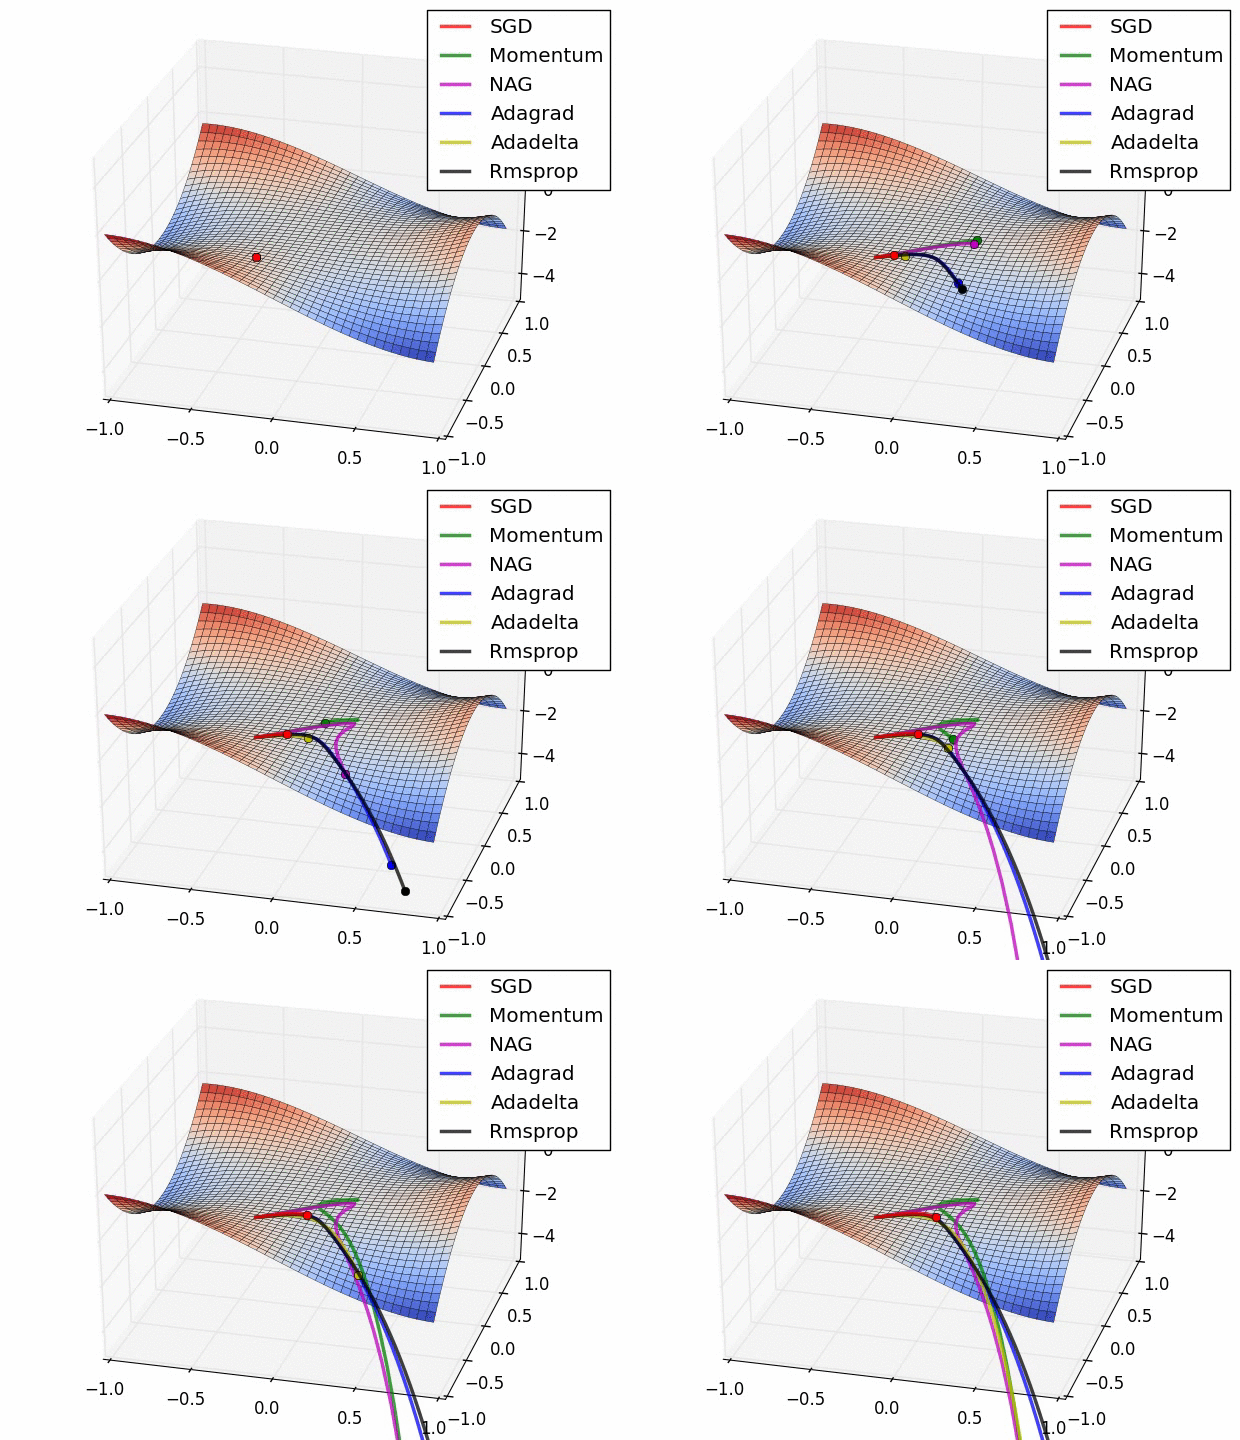
五种优化器对比总结 各种优化器来源
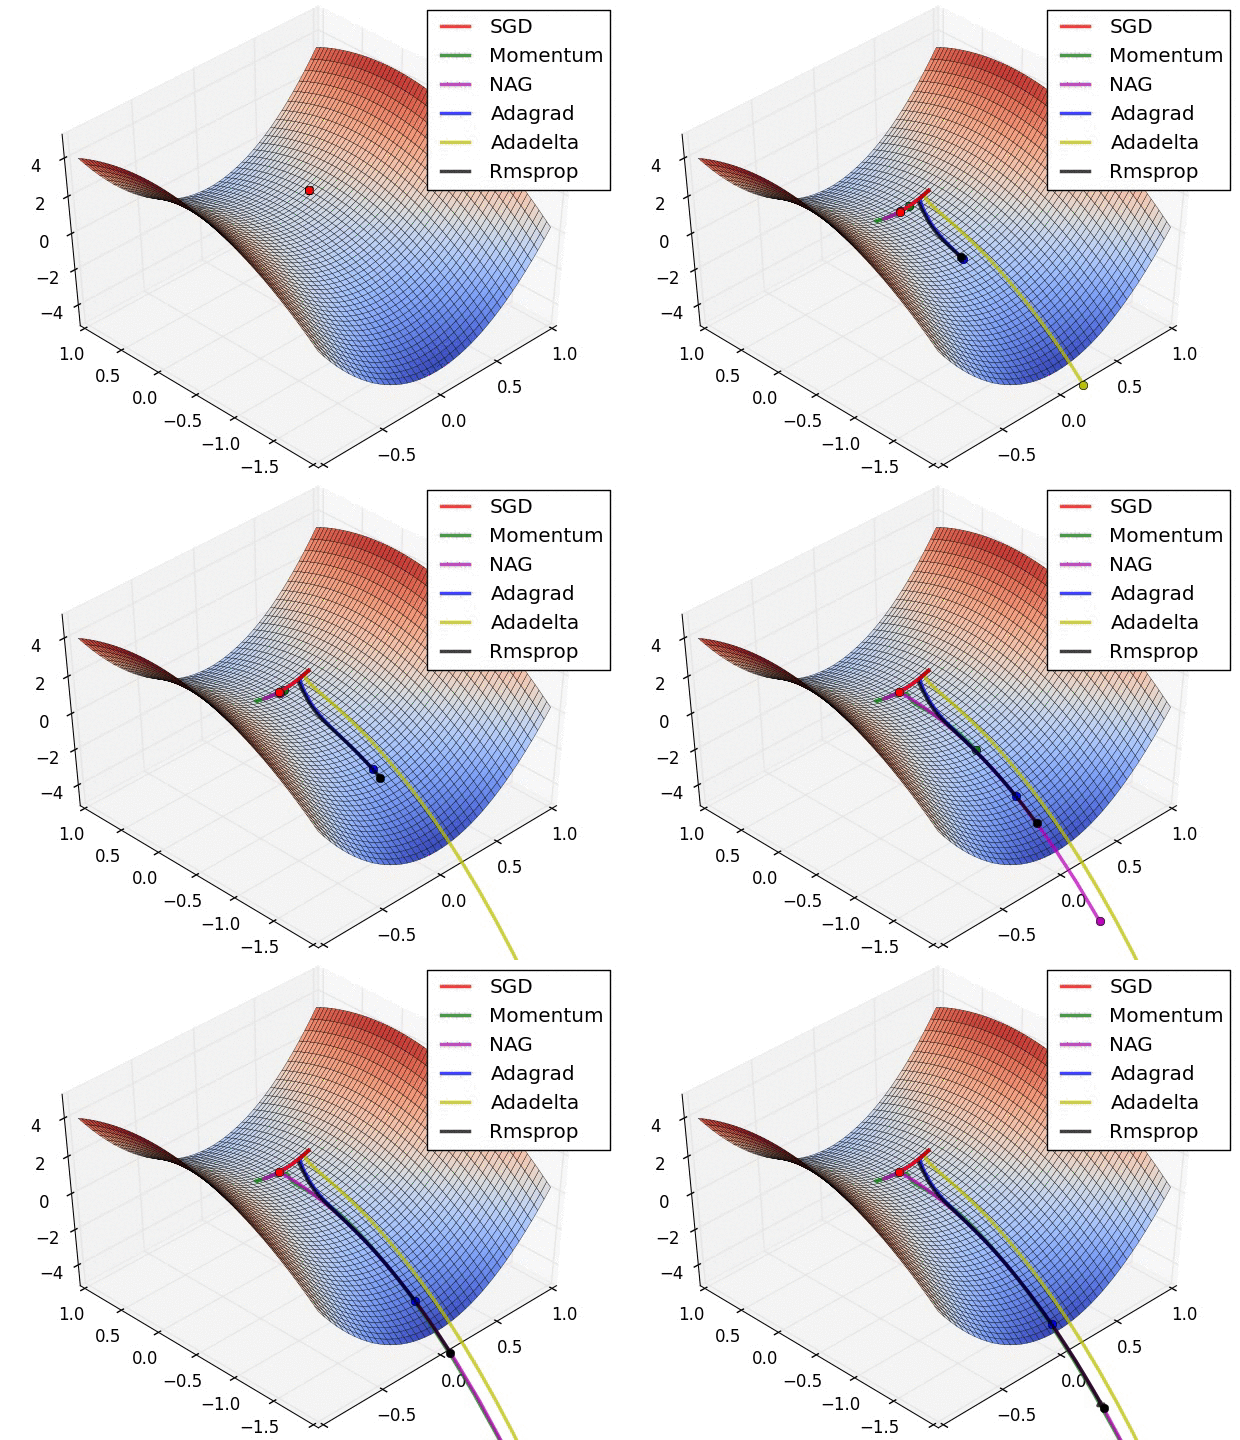
Visualizing Optimization Algos Algos without scaling based on gradient information really struggle to break symmetry here - SGD gets no where and Nesterov Accelerated Gradient / Momentum exhibits oscillations until they build up velocity in the optimization direction.
Algos that scale step size based on the gradient quickly break symmetry and begin descent.
Due to the large initial gradient, velocity based techniques shoot off and bounce around - adagrad almost goes unstable for the same reason.
Algos that scale gradients/step sizes like adadelta and RMSProp proceed more like accelerated SGD and handle large gradients with more stability.
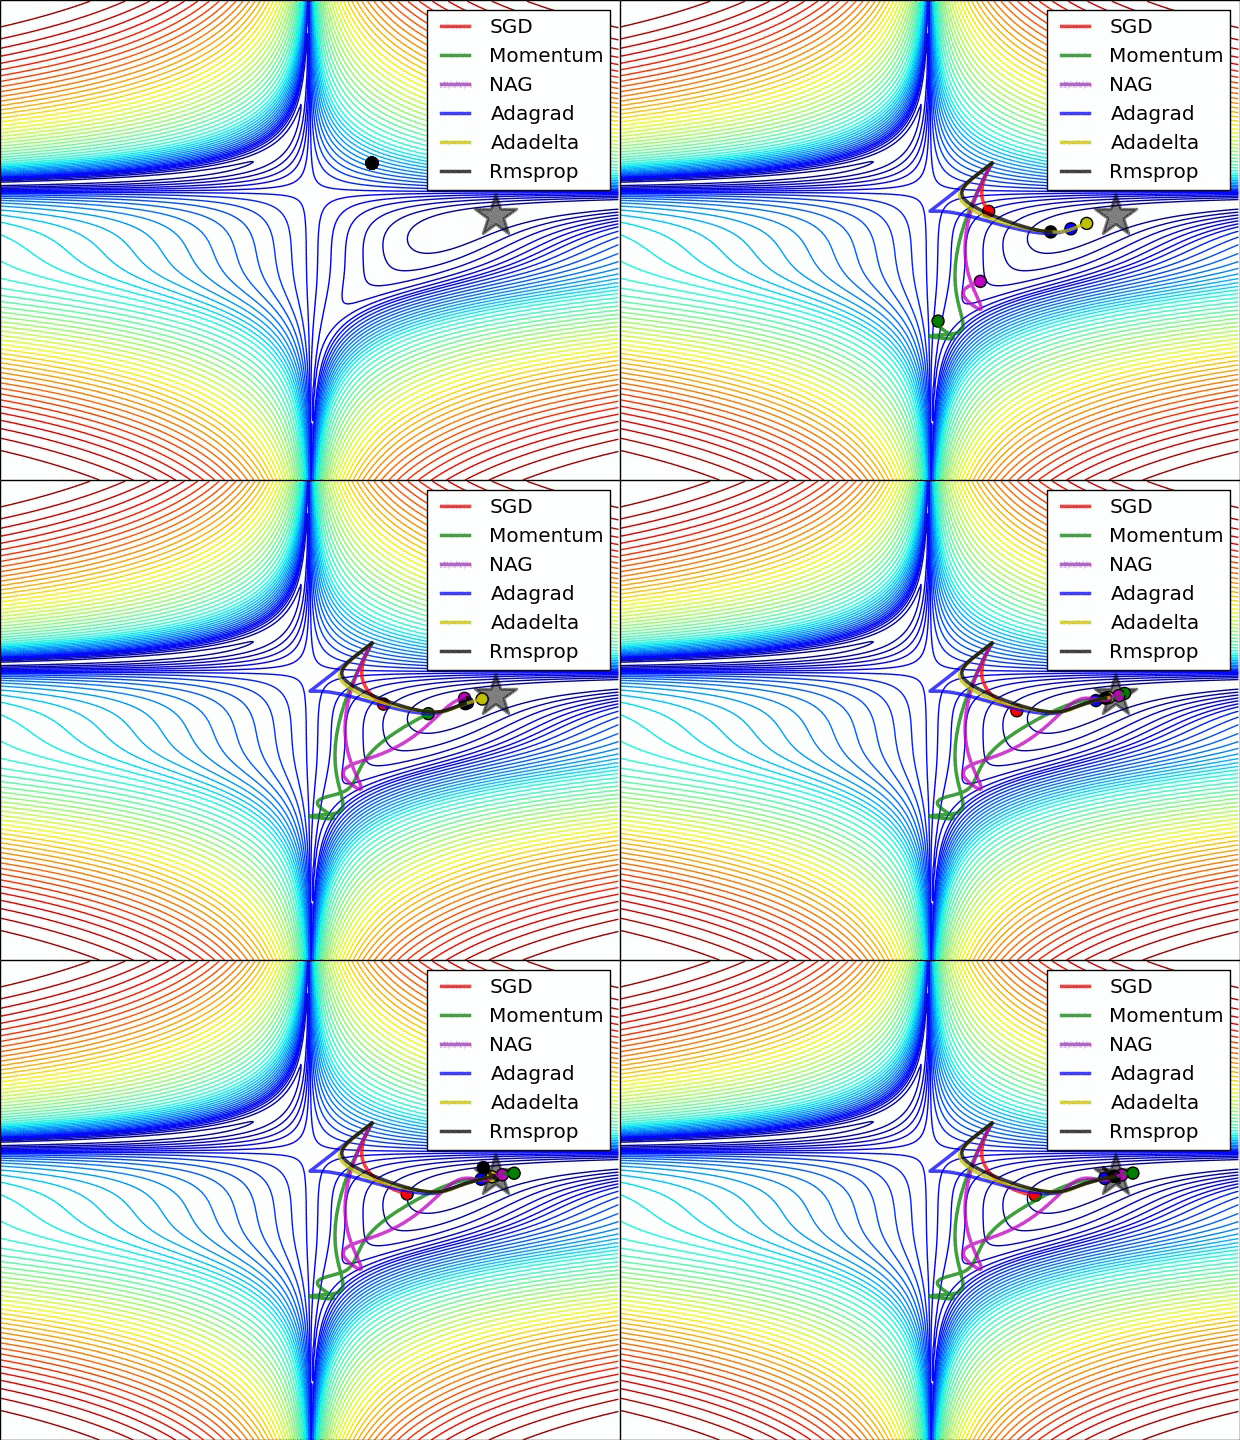
Behavior around a saddle point.
NAG/Momentum again like to explore around, almost taking a different path.
Adadelta/Adagrad/RMSProp proceed like accelerated SGD.
SGD 参数更新公式最重要的是把一阶动量和二阶动量计算出来
1 total_time 5.486814260482788
SGDM 参数更新公式最重要的是把一阶动量和二阶动量计算出来
1 total_time 5.486814260482788
Adagrad $ m{t} = g {t} $
$ V{t} = \sum {\tau = 1}^{t} = g_{\tau}^{2} $
$ \eta{t} = lr·m {t} / \sqrt{V{t}} = lr · g {t} / (\sqrt{ \sum{\tau = 1}^{t} = g {\tau}^{2}}) $
一阶动量mt是当前时刻的梯度
二阶动量是梯度平方的累计和
$ m{t} = g {t} $
$ V{t} = \sum {\tau = 1}^{t} = g_{\tau}^{2} $
1 total_time 5.356388568878174
RMSProp $ m{t} = g {t} $
$ V{t} = \beta · V {t-1} + (1 - \beta) · g_{t}^{2} $
$ \eta{t} = lr·m {t} / \sqrt{V{t}} = lr · g {t} / (\sqrt{\beta · V{t-1} + (1 - \beta) · g {t}^{2}}) $
$ m{t} = g {t} $
$ V{t} = \beta · V {t-1} + (1 - \beta) · g_{t}^{2} $
1 total_time 5.9049718379974365
Adam 修正一阶动量的偏差:$ \widehat{m{t}} = \frac{m {t}}{1 - \beta_{1}^{t}} $
修正二阶动量的偏差:$ \widehat{V{t}} = \frac{V {t}}{1 - \beta_{2}^{t}} $
adam一阶动量是和含momentum的SGD一阶动量一样
二阶动量表达是和RMSProp的二阶动量表达式一样
$ \widehat{m{t}} = \frac{m {t}}{1 - \beta_{1}^{t}} $
$ \widehat{V{t}} = \frac{V {t}}{1 - \beta_{2}^{t}} $
1 total_time 6.299233913421631
其他API tf.cast 1 2 3 tf.cast( x, dtype, name=None )
功能:转换数据(张量)类型。
参数:x:待转换的数据(张量)dtype:目标数据类型name:定义操作的名称(可选参数)
返回:数据类型为dtype,shape与x相同的张量
例子:1 2 3 x = tf.constant([1.8 , 2.2 ], dtype=tf.float32) print (tf.cast(x, tf.int32))>>> tf.Tensor([1 2 ], shape=(2 ,), dtype=int32)
tf.random.normal 1 2 3 tf.random.normal( shape, mean=0.0 , stddev=1.0 , dtype=tf.dtypes.float32, seed=None , name=None )
功能:生成服从正态分布的随机值
参数:x:一维张量mean:正态分布的均值stddev:正态分布的方差
返回:满足指定shape并且服从正态分布的张量
例子:1 2 3 4 5 6 tf.random.normal([3 , 5 ]) >>> <tf.Tensor: id =7 , shape=(3 , 5 ), dtype=float32, numpy=array([[-0.3951666 , -0.06858674 , 0.29626969 , 0.8070933 , -0.81376624 ], [ 0.09532423 , -0.20840745 , 0.37404788 , 0.5459829 , 0.17986278 ], [-1.0439969 , -0.8826001 , 0.7081867 , -0.40955627 , -2.6596873 ]], dtype=float32)>
tf.where 1 2 3 tf.where( condition, x=None , y=None , name=None )
功能:根据condition,取x或y中的值。如果为True,对应位置取x的值;如果为False,对应位置取y的值。
参数:condition:bool型张量x:与y shape相同的张量y:与x shape相同的张量
返回:shape与x相同的张量
例子:
1 2 print (tf.where([True , False , True , False ], [1 ,2 ,3 ,4 ], [5 ,6 ,7 ,8 ]))>>> tf.Tensor([1 6 3 8 ], shape=(4 ,), dtype=int32)
